Laotian vs Immigrants from Turkey In Labor Force | Age 16-19
COMPARE
Laotian
Immigrants from Turkey
In Labor Force | Age 16-19
In Labor Force | Age 16-19 Comparison
Laotians
Immigrants from Turkey
34.9%
IN LABOR FORCE | AGE 16-19
2.4/ 100
METRIC RATING
247th/ 347
METRIC RANK
34.9%
IN LABOR FORCE | AGE 16-19
2.6/ 100
METRIC RATING
244th/ 347
METRIC RANK
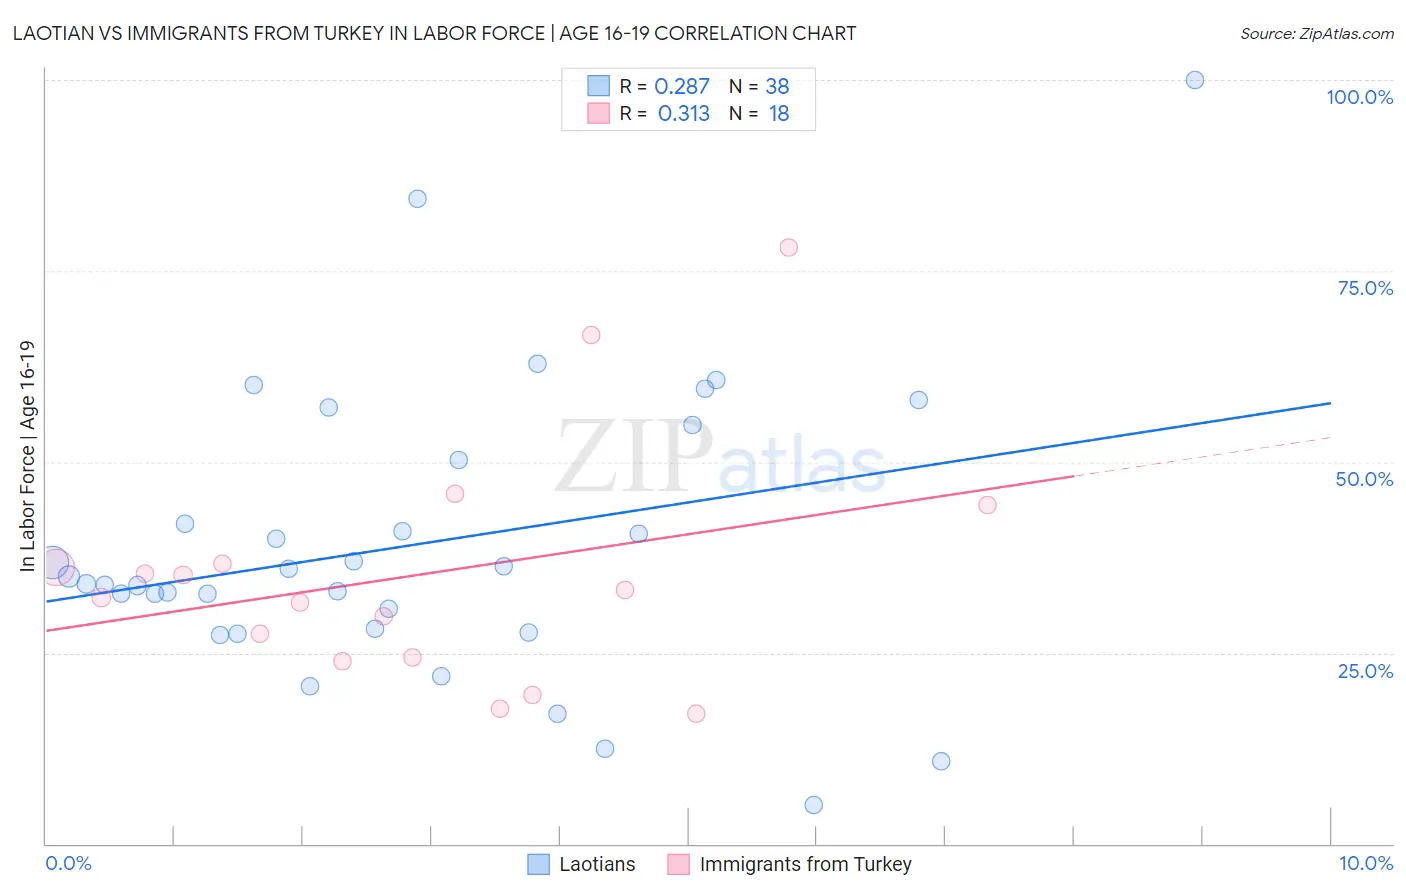
Laotian vs Immigrants from Turkey In Labor Force | Age 16-19 Correlation Chart
The statistical analysis conducted on geographies consisting of 224,669,771 people shows a weak positive correlation between the proportion of Laotians and labor force participation rate among population between the ages 16 and 19 in the United States with a correlation coefficient (R) of 0.287 and weighted average of 34.9%. Similarly, the statistical analysis conducted on geographies consisting of 222,808,071 people shows a mild positive correlation between the proportion of Immigrants from Turkey and labor force participation rate among population between the ages 16 and 19 in the United States with a correlation coefficient (R) of 0.313 and weighted average of 34.9%, a difference of 0.090%.
In Labor Force | Age 16-19 Correlation Summary
| Measurement | Laotian | Immigrants from Turkey |
| Minimum | 5.1% | 17.1% |
| Maximum | 100.0% | 78.1% |
| Range | 94.9% | 61.0% |
| Mean | 39.1% | 35.3% |
| Median | 34.5% | 32.8% |
| Interquartile 25% (IQ1) | 28.1% | 24.3% |
| Interquartile 75% (IQ3) | 50.3% | 36.6% |
| Interquartile Range (IQR) | 22.2% | 12.3% |
| Standard Deviation (Sample) | 19.0% | 15.8% |
| Standard Deviation (Population) | 18.8% | 15.4% |
Demographics Similar to Laotians and Immigrants from Turkey by In Labor Force | Age 16-19
In terms of in labor force | age 16-19, the demographic groups most similar to Laotians are Immigrants from Sri Lanka (34.9%, a difference of 0.010%), Immigrants from Greece (34.9%, a difference of 0.030%), Central American (34.8%, a difference of 0.090%), Pueblo (34.9%, a difference of 0.11%), and Immigrants from Ukraine (34.8%, a difference of 0.12%). Similarly, the demographic groups most similar to Immigrants from Turkey are Pueblo (34.9%, a difference of 0.020%), Uruguayan (34.9%, a difference of 0.050%), Immigrants from Greece (34.9%, a difference of 0.060%), Immigrants from Sri Lanka (34.9%, a difference of 0.080%), and Immigrants from Ireland (35.0%, a difference of 0.17%).
| Demographics | Rating | Rank | In Labor Force | Age 16-19 |
| Immigrants | Philippines | 4.0 /100 | #235 | Tragic 35.1% |
| Immigrants | Australia | 3.6 /100 | #236 | Tragic 35.1% |
| Immigrants | India | 3.5 /100 | #237 | Tragic 35.0% |
| Immigrants | Vietnam | 3.4 /100 | #238 | Tragic 35.0% |
| Inupiat | 3.2 /100 | #239 | Tragic 35.0% |
| Immigrants | Central America | 3.0 /100 | #240 | Tragic 35.0% |
| Immigrants | Ireland | 2.9 /100 | #241 | Tragic 35.0% |
| Uruguayans | 2.6 /100 | #242 | Tragic 34.9% |
| Pueblo | 2.6 /100 | #243 | Tragic 34.9% |
| Immigrants | Turkey | 2.6 /100 | #244 | Tragic 34.9% |
| Immigrants | Greece | 2.4 /100 | #245 | Tragic 34.9% |
| Immigrants | Sri Lanka | 2.4 /100 | #246 | Tragic 34.9% |
| Laotians | 2.4 /100 | #247 | Tragic 34.9% |
| Central Americans | 2.2 /100 | #248 | Tragic 34.8% |
| Immigrants | Ukraine | 2.2 /100 | #249 | Tragic 34.8% |
| Immigrants | Pakistan | 2.0 /100 | #250 | Tragic 34.8% |
| Immigrants | Western Asia | 2.0 /100 | #251 | Tragic 34.8% |
| Immigrants | Chile | 2.0 /100 | #252 | Tragic 34.8% |
| Immigrants | Japan | 1.5 /100 | #253 | Tragic 34.7% |
| Bahamians | 1.4 /100 | #254 | Tragic 34.6% |
| Peruvians | 1.4 /100 | #255 | Tragic 34.6% |