Kiowa vs Immigrants from Egypt In Labor Force | Age 30-34
COMPARE
Kiowa
Immigrants from Egypt
In Labor Force | Age 30-34
In Labor Force | Age 30-34 Comparison
Kiowa
Immigrants from Egypt
79.8%
IN LABOR FORCE | AGE 30-34
0.0/ 100
METRIC RATING
332nd/ 347
METRIC RANK
85.1%
IN LABOR FORCE | AGE 30-34
93.2/ 100
METRIC RATING
121st/ 347
METRIC RANK
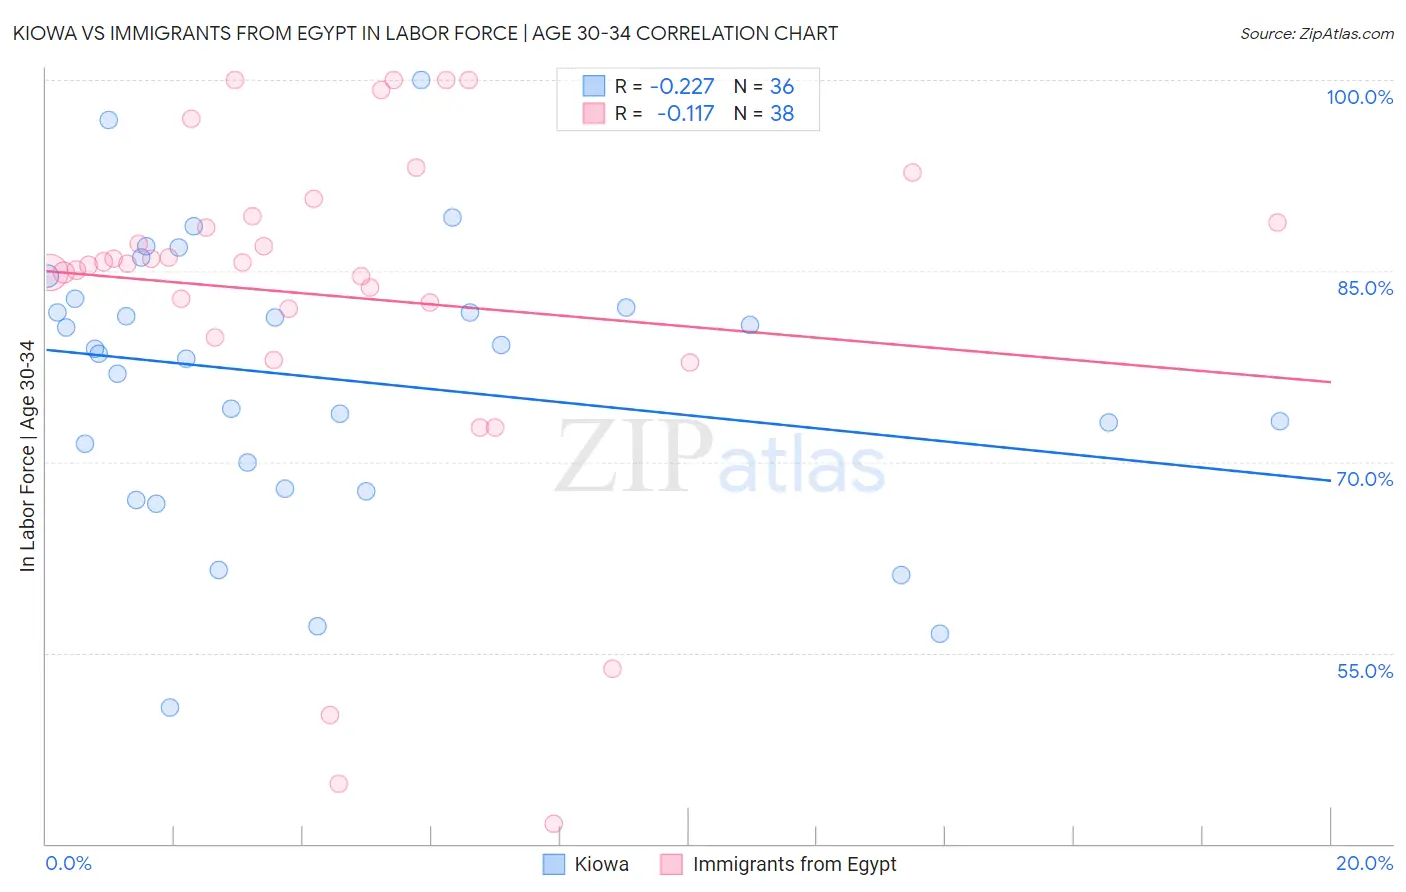
Kiowa vs Immigrants from Egypt In Labor Force | Age 30-34 Correlation Chart
The statistical analysis conducted on geographies consisting of 56,095,745 people shows a weak negative correlation between the proportion of Kiowa and labor force participation rate among population between the ages 30 and 34 in the United States with a correlation coefficient (R) of -0.227 and weighted average of 79.8%. Similarly, the statistical analysis conducted on geographies consisting of 245,430,177 people shows a poor negative correlation between the proportion of Immigrants from Egypt and labor force participation rate among population between the ages 30 and 34 in the United States with a correlation coefficient (R) of -0.117 and weighted average of 85.1%, a difference of 6.6%.
In Labor Force | Age 30-34 Correlation Summary
| Measurement | Kiowa | Immigrants from Egypt |
| Minimum | 50.7% | 41.6% |
| Maximum | 100.0% | 100.0% |
| Range | 49.3% | 58.4% |
| Mean | 76.5% | 83.0% |
| Median | 78.7% | 85.6% |
| Interquartile 25% (IQ1) | 69.0% | 82.0% |
| Interquartile 75% (IQ3) | 82.5% | 89.3% |
| Interquartile Range (IQR) | 13.5% | 7.3% |
| Standard Deviation (Sample) | 11.0% | 14.2% |
| Standard Deviation (Population) | 10.8% | 14.0% |
Similar Demographics by In Labor Force | Age 30-34
Demographics Similar to Kiowa by In Labor Force | Age 30-34
In terms of in labor force | age 30-34, the demographic groups most similar to Kiowa are Houma (79.9%, a difference of 0.11%), Inupiat (79.7%, a difference of 0.12%), Pueblo (80.0%, a difference of 0.28%), Creek (80.4%, a difference of 0.68%), and Sioux (80.4%, a difference of 0.69%).
| Demographics | Rating | Rank | In Labor Force | Age 30-34 |
| Dutch West Indians | 0.0 /100 | #325 | Tragic 81.0% |
| Seminole | 0.0 /100 | #326 | Tragic 80.8% |
| Colville | 0.0 /100 | #327 | Tragic 80.7% |
| Sioux | 0.0 /100 | #328 | Tragic 80.4% |
| Creek | 0.0 /100 | #329 | Tragic 80.4% |
| Pueblo | 0.0 /100 | #330 | Tragic 80.0% |
| Houma | 0.0 /100 | #331 | Tragic 79.9% |
| Kiowa | 0.0 /100 | #332 | Tragic 79.8% |
| Inupiat | 0.0 /100 | #333 | Tragic 79.7% |
| Hopi | 0.0 /100 | #334 | Tragic 79.3% |
| Marshallese | 0.0 /100 | #335 | Tragic 79.2% |
| Natives/Alaskans | 0.0 /100 | #336 | Tragic 79.2% |
| Yakama | 0.0 /100 | #337 | Tragic 79.1% |
| Pima | 0.0 /100 | #338 | Tragic 79.0% |
| Apache | 0.0 /100 | #339 | Tragic 79.0% |
Demographics Similar to Immigrants from Egypt by In Labor Force | Age 30-34
In terms of in labor force | age 30-34, the demographic groups most similar to Immigrants from Egypt are Immigrants from Southern Europe (85.1%, a difference of 0.0%), Asian (85.1%, a difference of 0.010%), Immigrants from Kuwait (85.1%, a difference of 0.020%), Immigrants from Denmark (85.1%, a difference of 0.030%), and Immigrants from Malaysia (85.1%, a difference of 0.030%).
| Demographics | Rating | Rank | In Labor Force | Age 30-34 |
| Yugoslavians | 94.7 /100 | #114 | Exceptional 85.1% |
| Immigrants | South Central Asia | 94.6 /100 | #115 | Exceptional 85.1% |
| Egyptians | 94.5 /100 | #116 | Exceptional 85.1% |
| Immigrants | Denmark | 94.3 /100 | #117 | Exceptional 85.1% |
| Immigrants | Malaysia | 94.2 /100 | #118 | Exceptional 85.1% |
| Asians | 93.4 /100 | #119 | Exceptional 85.1% |
| Immigrants | Southern Europe | 93.3 /100 | #120 | Exceptional 85.1% |
| Immigrants | Egypt | 93.2 /100 | #121 | Exceptional 85.1% |
| Immigrants | Kuwait | 92.6 /100 | #122 | Exceptional 85.1% |
| Armenians | 92.2 /100 | #123 | Exceptional 85.0% |
| Australians | 92.0 /100 | #124 | Exceptional 85.0% |
| Immigrants | Jordan | 91.5 /100 | #125 | Exceptional 85.0% |
| Austrians | 90.9 /100 | #126 | Exceptional 85.0% |
| Slavs | 90.7 /100 | #127 | Exceptional 85.0% |
| Immigrants | Argentina | 90.6 /100 | #128 | Exceptional 85.0% |