Kiowa vs Immigrants from England In Labor Force | Age 30-34
COMPARE
Kiowa
Immigrants from England
In Labor Force | Age 30-34
In Labor Force | Age 30-34 Comparison
Kiowa
Immigrants from England
79.8%
IN LABOR FORCE | AGE 30-34
0.0/ 100
METRIC RATING
332nd/ 347
METRIC RANK
84.7%
IN LABOR FORCE | AGE 30-34
51.7/ 100
METRIC RATING
172nd/ 347
METRIC RANK
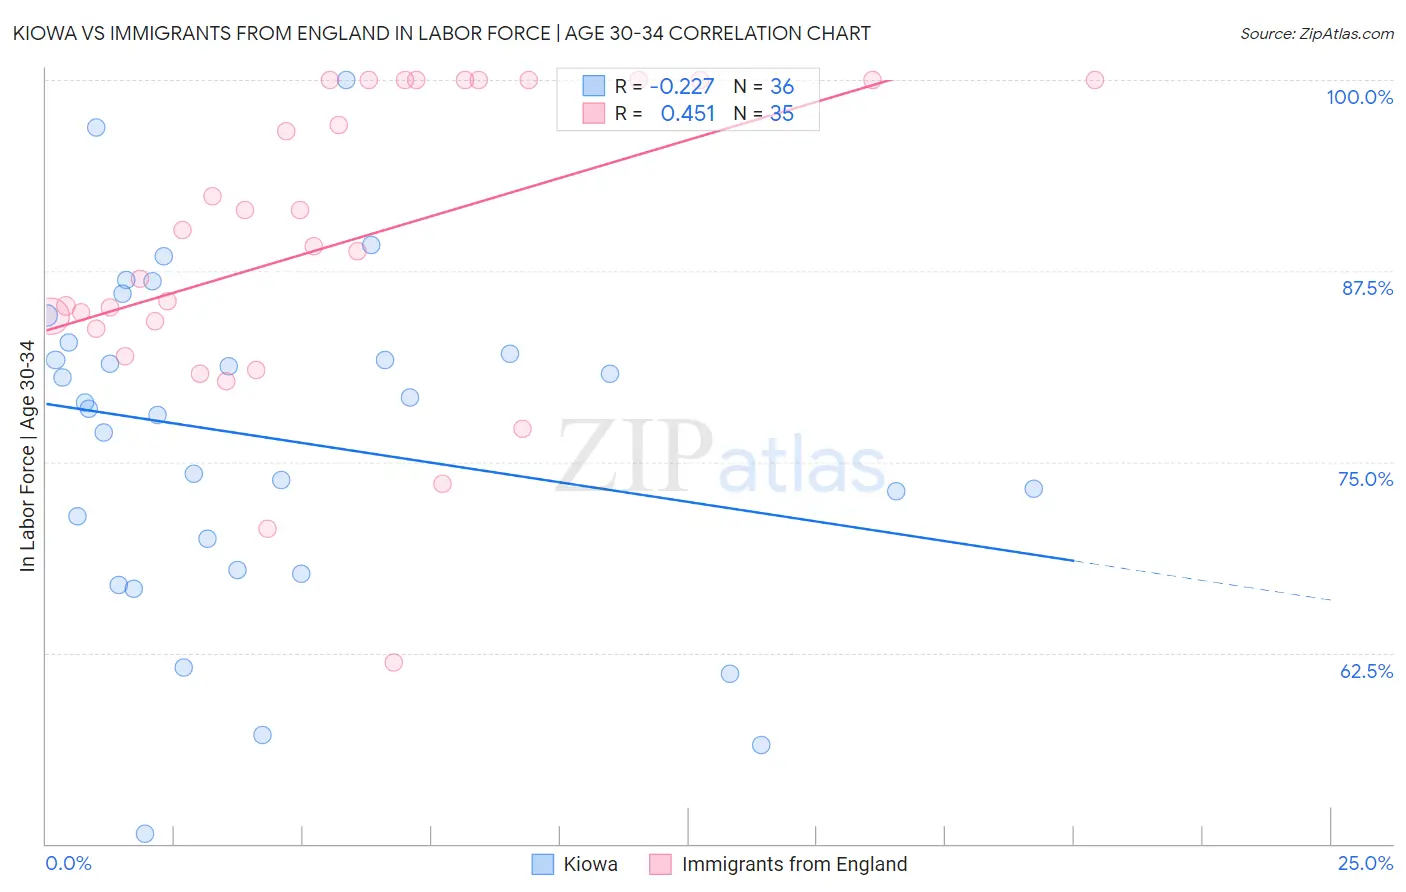
Kiowa vs Immigrants from England In Labor Force | Age 30-34 Correlation Chart
The statistical analysis conducted on geographies consisting of 56,095,745 people shows a weak negative correlation between the proportion of Kiowa and labor force participation rate among population between the ages 30 and 34 in the United States with a correlation coefficient (R) of -0.227 and weighted average of 79.8%. Similarly, the statistical analysis conducted on geographies consisting of 391,631,139 people shows a moderate positive correlation between the proportion of Immigrants from England and labor force participation rate among population between the ages 30 and 34 in the United States with a correlation coefficient (R) of 0.451 and weighted average of 84.7%, a difference of 6.1%.
In Labor Force | Age 30-34 Correlation Summary
| Measurement | Kiowa | Immigrants from England |
| Minimum | 50.7% | 61.9% |
| Maximum | 100.0% | 100.0% |
| Range | 49.3% | 38.1% |
| Mean | 76.5% | 89.3% |
| Median | 78.7% | 89.1% |
| Interquartile 25% (IQ1) | 69.0% | 83.7% |
| Interquartile 75% (IQ3) | 82.5% | 100.0% |
| Interquartile Range (IQR) | 13.5% | 16.3% |
| Standard Deviation (Sample) | 11.0% | 9.9% |
| Standard Deviation (Population) | 10.8% | 9.7% |
Similar Demographics by In Labor Force | Age 30-34
Demographics Similar to Kiowa by In Labor Force | Age 30-34
In terms of in labor force | age 30-34, the demographic groups most similar to Kiowa are Houma (79.9%, a difference of 0.11%), Inupiat (79.7%, a difference of 0.12%), Pueblo (80.0%, a difference of 0.28%), Creek (80.4%, a difference of 0.68%), and Sioux (80.4%, a difference of 0.69%).
| Demographics | Rating | Rank | In Labor Force | Age 30-34 |
| Dutch West Indians | 0.0 /100 | #325 | Tragic 81.0% |
| Seminole | 0.0 /100 | #326 | Tragic 80.8% |
| Colville | 0.0 /100 | #327 | Tragic 80.7% |
| Sioux | 0.0 /100 | #328 | Tragic 80.4% |
| Creek | 0.0 /100 | #329 | Tragic 80.4% |
| Pueblo | 0.0 /100 | #330 | Tragic 80.0% |
| Houma | 0.0 /100 | #331 | Tragic 79.9% |
| Kiowa | 0.0 /100 | #332 | Tragic 79.8% |
| Inupiat | 0.0 /100 | #333 | Tragic 79.7% |
| Hopi | 0.0 /100 | #334 | Tragic 79.3% |
| Marshallese | 0.0 /100 | #335 | Tragic 79.2% |
| Natives/Alaskans | 0.0 /100 | #336 | Tragic 79.2% |
| Yakama | 0.0 /100 | #337 | Tragic 79.1% |
| Pima | 0.0 /100 | #338 | Tragic 79.0% |
| Apache | 0.0 /100 | #339 | Tragic 79.0% |
Demographics Similar to Immigrants from England by In Labor Force | Age 30-34
In terms of in labor force | age 30-34, the demographic groups most similar to Immigrants from England are Immigrants from Peru (84.7%, a difference of 0.0%), South American Indian (84.7%, a difference of 0.0%), Immigrants from Burma/Myanmar (84.7%, a difference of 0.0%), Irish (84.7%, a difference of 0.0%), and Israeli (84.7%, a difference of 0.0%).
| Demographics | Rating | Rank | In Labor Force | Age 30-34 |
| Immigrants | Western Europe | 56.7 /100 | #165 | Average 84.7% |
| Afghans | 55.2 /100 | #166 | Average 84.7% |
| Immigrants | South Eastern Asia | 54.2 /100 | #167 | Average 84.7% |
| Immigrants | Peru | 52.4 /100 | #168 | Average 84.7% |
| South American Indians | 52.1 /100 | #169 | Average 84.7% |
| Immigrants | Burma/Myanmar | 52.0 /100 | #170 | Average 84.7% |
| Irish | 52.0 /100 | #171 | Average 84.7% |
| Immigrants | England | 51.7 /100 | #172 | Average 84.7% |
| Israelis | 51.1 /100 | #173 | Average 84.7% |
| Finns | 50.0 /100 | #174 | Average 84.7% |
| Immigrants | South America | 50.0 /100 | #175 | Average 84.7% |
| Immigrants | Uzbekistan | 49.1 /100 | #176 | Average 84.7% |
| Laotians | 46.9 /100 | #177 | Average 84.7% |
| Okinawans | 44.1 /100 | #178 | Average 84.6% |
| Immigrants | Nigeria | 42.5 /100 | #179 | Average 84.6% |