Kiowa vs Immigrants from Bosnia and Herzegovina In Labor Force | Age 35-44
COMPARE
Kiowa
Immigrants from Bosnia and Herzegovina
In Labor Force | Age 35-44
In Labor Force | Age 35-44 Comparison
Kiowa
Immigrants from Bosnia and Herzegovina
79.2%
IN LABOR FORCE | AGE 35-44
0.0/ 100
METRIC RATING
333rd/ 347
METRIC RANK
85.4%
IN LABOR FORCE | AGE 35-44
100.0/ 100
METRIC RATING
22nd/ 347
METRIC RANK
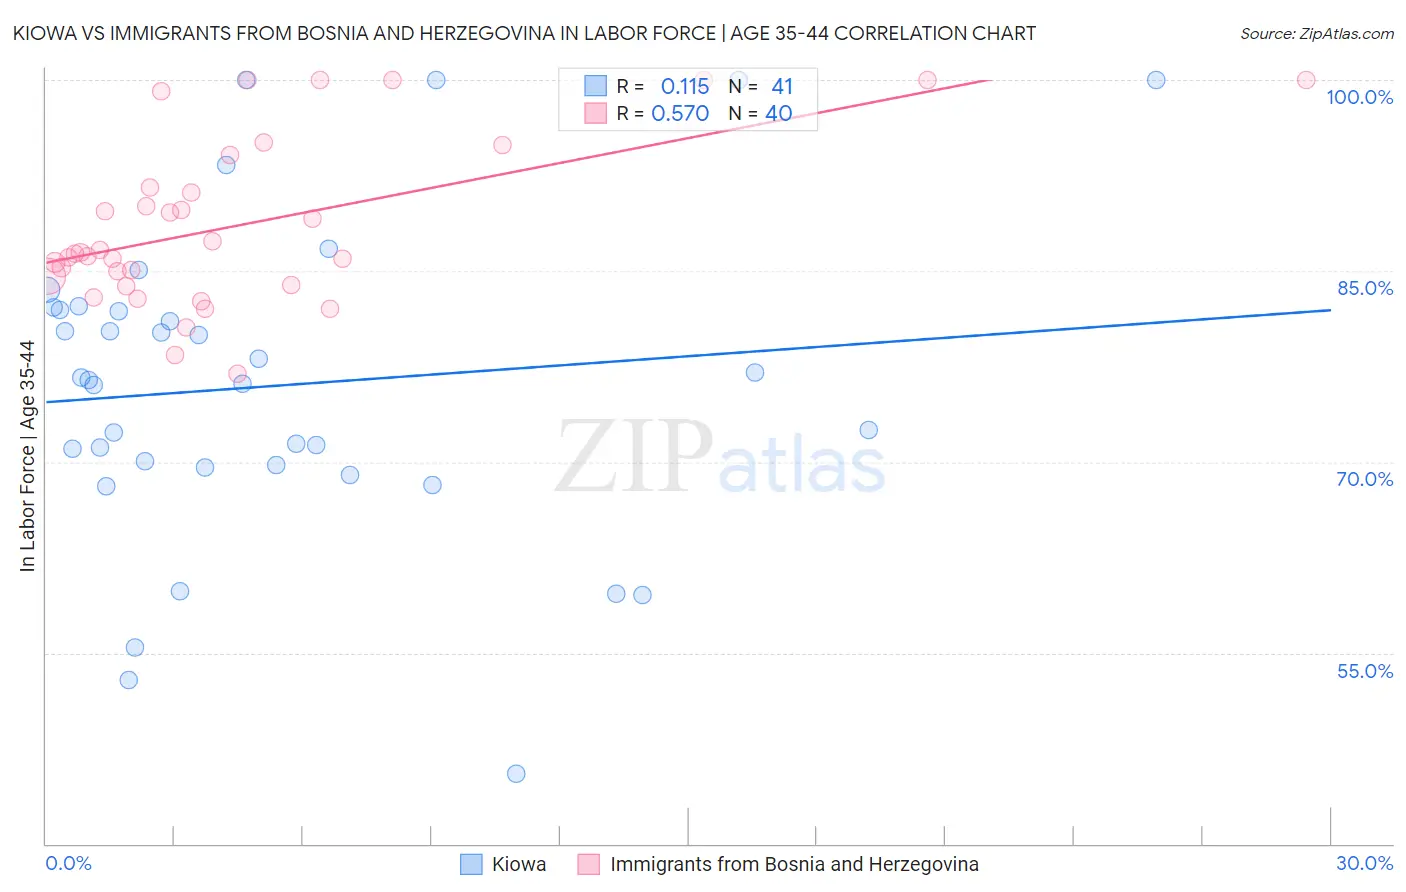
Kiowa vs Immigrants from Bosnia and Herzegovina In Labor Force | Age 35-44 Correlation Chart
The statistical analysis conducted on geographies consisting of 56,099,396 people shows a poor positive correlation between the proportion of Kiowa and labor force participation rate among population between the ages 35 and 44 in the United States with a correlation coefficient (R) of 0.115 and weighted average of 79.2%. Similarly, the statistical analysis conducted on geographies consisting of 156,807,343 people shows a substantial positive correlation between the proportion of Immigrants from Bosnia and Herzegovina and labor force participation rate among population between the ages 35 and 44 in the United States with a correlation coefficient (R) of 0.570 and weighted average of 85.4%, a difference of 7.9%.
In Labor Force | Age 35-44 Correlation Summary
| Measurement | Kiowa | Immigrants from Bosnia and Herzegovina |
| Minimum | 45.5% | 76.9% |
| Maximum | 100.0% | 100.0% |
| Range | 54.5% | 23.1% |
| Mean | 76.0% | 88.7% |
| Median | 76.4% | 86.4% |
| Interquartile 25% (IQ1) | 69.7% | 84.3% |
| Interquartile 75% (IQ3) | 82.0% | 92.8% |
| Interquartile Range (IQR) | 12.4% | 8.6% |
| Standard Deviation (Sample) | 12.5% | 6.5% |
| Standard Deviation (Population) | 12.3% | 6.5% |
Similar Demographics by In Labor Force | Age 35-44
Demographics Similar to Kiowa by In Labor Force | Age 35-44
In terms of in labor force | age 35-44, the demographic groups most similar to Kiowa are Yakama (79.0%, a difference of 0.29%), Ute (79.4%, a difference of 0.33%), Houma (79.5%, a difference of 0.39%), Native/Alaskan (78.9%, a difference of 0.40%), and Cheyenne (79.5%, a difference of 0.41%).
| Demographics | Rating | Rank | In Labor Force | Age 35-44 |
| Seminole | 0.0 /100 | #326 | Tragic 80.4% |
| Sioux | 0.0 /100 | #327 | Tragic 80.2% |
| Creek | 0.0 /100 | #328 | Tragic 80.0% |
| Menominee | 0.0 /100 | #329 | Tragic 79.7% |
| Cheyenne | 0.0 /100 | #330 | Tragic 79.5% |
| Houma | 0.0 /100 | #331 | Tragic 79.5% |
| Ute | 0.0 /100 | #332 | Tragic 79.4% |
| Kiowa | 0.0 /100 | #333 | Tragic 79.2% |
| Yakama | 0.0 /100 | #334 | Tragic 79.0% |
| Natives/Alaskans | 0.0 /100 | #335 | Tragic 78.9% |
| Arapaho | 0.0 /100 | #336 | Tragic 78.1% |
| Apache | 0.0 /100 | #337 | Tragic 77.9% |
| Pueblo | 0.0 /100 | #338 | Tragic 77.4% |
| Yup'ik | 0.0 /100 | #339 | Tragic 77.3% |
| Lumbee | 0.0 /100 | #340 | Tragic 77.0% |
Demographics Similar to Immigrants from Bosnia and Herzegovina by In Labor Force | Age 35-44
In terms of in labor force | age 35-44, the demographic groups most similar to Immigrants from Bosnia and Herzegovina are Immigrants from Eastern Africa (85.4%, a difference of 0.020%), Bulgarian (85.5%, a difference of 0.040%), Latvian (85.4%, a difference of 0.080%), Paraguayan (85.4%, a difference of 0.090%), and Immigrants from Liberia (85.4%, a difference of 0.090%).
| Demographics | Rating | Rank | In Labor Force | Age 35-44 |
| Norwegians | 100.0 /100 | #15 | Exceptional 85.6% |
| Immigrants | Ireland | 100.0 /100 | #16 | Exceptional 85.6% |
| Immigrants | North Macedonia | 100.0 /100 | #17 | Exceptional 85.6% |
| Carpatho Rusyns | 100.0 /100 | #18 | Exceptional 85.6% |
| Slovenes | 100.0 /100 | #19 | Exceptional 85.6% |
| Immigrants | Serbia | 100.0 /100 | #20 | Exceptional 85.5% |
| Bulgarians | 100.0 /100 | #21 | Exceptional 85.5% |
| Immigrants | Bosnia and Herzegovina | 100.0 /100 | #22 | Exceptional 85.4% |
| Immigrants | Eastern Africa | 100.0 /100 | #23 | Exceptional 85.4% |
| Latvians | 99.9 /100 | #24 | Exceptional 85.4% |
| Paraguayans | 99.9 /100 | #25 | Exceptional 85.4% |
| Immigrants | Liberia | 99.9 /100 | #26 | Exceptional 85.4% |
| Immigrants | Lithuania | 99.9 /100 | #27 | Exceptional 85.4% |
| Immigrants | Greece | 99.9 /100 | #28 | Exceptional 85.3% |
| Cambodians | 99.9 /100 | #29 | Exceptional 85.3% |