Kiowa vs Sudanese In Labor Force | Age 35-44
COMPARE
Kiowa
Sudanese
In Labor Force | Age 35-44
In Labor Force | Age 35-44 Comparison
Kiowa
Sudanese
79.2%
IN LABOR FORCE | AGE 35-44
0.0/ 100
METRIC RATING
333rd/ 347
METRIC RANK
85.0%
IN LABOR FORCE | AGE 35-44
99.0/ 100
METRIC RATING
69th/ 347
METRIC RANK
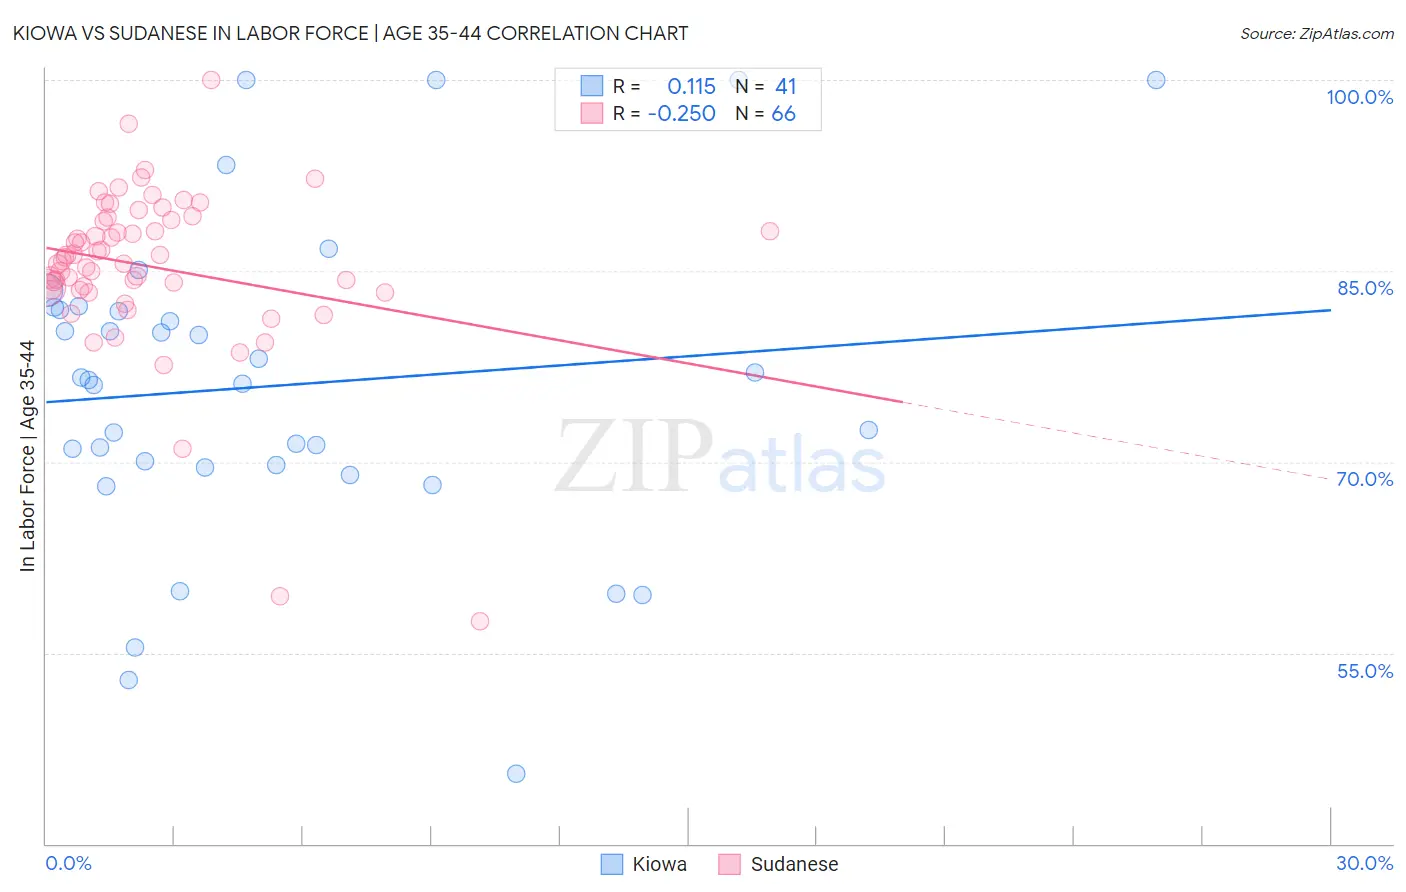
Kiowa vs Sudanese In Labor Force | Age 35-44 Correlation Chart
The statistical analysis conducted on geographies consisting of 56,099,396 people shows a poor positive correlation between the proportion of Kiowa and labor force participation rate among population between the ages 35 and 44 in the United States with a correlation coefficient (R) of 0.115 and weighted average of 79.2%. Similarly, the statistical analysis conducted on geographies consisting of 110,129,282 people shows a weak negative correlation between the proportion of Sudanese and labor force participation rate among population between the ages 35 and 44 in the United States with a correlation coefficient (R) of -0.250 and weighted average of 85.0%, a difference of 7.3%.
In Labor Force | Age 35-44 Correlation Summary
| Measurement | Kiowa | Sudanese |
| Minimum | 45.5% | 57.5% |
| Maximum | 100.0% | 100.0% |
| Range | 54.5% | 42.5% |
| Mean | 76.0% | 85.3% |
| Median | 76.4% | 85.9% |
| Interquartile 25% (IQ1) | 69.7% | 83.5% |
| Interquartile 75% (IQ3) | 82.0% | 89.0% |
| Interquartile Range (IQR) | 12.4% | 5.5% |
| Standard Deviation (Sample) | 12.5% | 6.6% |
| Standard Deviation (Population) | 12.3% | 6.5% |
Similar Demographics by In Labor Force | Age 35-44
Demographics Similar to Kiowa by In Labor Force | Age 35-44
In terms of in labor force | age 35-44, the demographic groups most similar to Kiowa are Yakama (79.0%, a difference of 0.29%), Ute (79.4%, a difference of 0.33%), Houma (79.5%, a difference of 0.39%), Native/Alaskan (78.9%, a difference of 0.40%), and Cheyenne (79.5%, a difference of 0.41%).
| Demographics | Rating | Rank | In Labor Force | Age 35-44 |
| Seminole | 0.0 /100 | #326 | Tragic 80.4% |
| Sioux | 0.0 /100 | #327 | Tragic 80.2% |
| Creek | 0.0 /100 | #328 | Tragic 80.0% |
| Menominee | 0.0 /100 | #329 | Tragic 79.7% |
| Cheyenne | 0.0 /100 | #330 | Tragic 79.5% |
| Houma | 0.0 /100 | #331 | Tragic 79.5% |
| Ute | 0.0 /100 | #332 | Tragic 79.4% |
| Kiowa | 0.0 /100 | #333 | Tragic 79.2% |
| Yakama | 0.0 /100 | #334 | Tragic 79.0% |
| Natives/Alaskans | 0.0 /100 | #335 | Tragic 78.9% |
| Arapaho | 0.0 /100 | #336 | Tragic 78.1% |
| Apache | 0.0 /100 | #337 | Tragic 77.9% |
| Pueblo | 0.0 /100 | #338 | Tragic 77.4% |
| Yup'ik | 0.0 /100 | #339 | Tragic 77.3% |
| Lumbee | 0.0 /100 | #340 | Tragic 77.0% |
Demographics Similar to Sudanese by In Labor Force | Age 35-44
In terms of in labor force | age 35-44, the demographic groups most similar to Sudanese are Brazilian (85.0%, a difference of 0.0%), Immigrants from Italy (85.0%, a difference of 0.010%), Italian (85.0%, a difference of 0.010%), Russian (85.0%, a difference of 0.010%), and Immigrants from Haiti (85.0%, a difference of 0.020%).
| Demographics | Rating | Rank | In Labor Force | Age 35-44 |
| Immigrants | Moldova | 99.3 /100 | #62 | Exceptional 85.0% |
| Immigrants | Uganda | 99.3 /100 | #63 | Exceptional 85.0% |
| Swedes | 99.2 /100 | #64 | Exceptional 85.0% |
| Immigrants | Brazil | 99.2 /100 | #65 | Exceptional 85.0% |
| Immigrants | Haiti | 99.1 /100 | #66 | Exceptional 85.0% |
| Immigrants | Italy | 99.1 /100 | #67 | Exceptional 85.0% |
| Italians | 99.1 /100 | #68 | Exceptional 85.0% |
| Sudanese | 99.0 /100 | #69 | Exceptional 85.0% |
| Brazilians | 99.0 /100 | #70 | Exceptional 85.0% |
| Russians | 99.0 /100 | #71 | Exceptional 85.0% |
| Immigrants | Singapore | 98.9 /100 | #72 | Exceptional 85.0% |
| Immigrants | Sri Lanka | 98.9 /100 | #73 | Exceptional 85.0% |
| Colombians | 98.8 /100 | #74 | Exceptional 85.0% |
| Immigrants | South Central Asia | 98.7 /100 | #75 | Exceptional 85.0% |
| Immigrants | Cuba | 98.6 /100 | #76 | Exceptional 84.9% |