Italian vs Slovene In Labor Force | Age > 16
COMPARE
Italian
Slovene
In Labor Force | Age > 16
In Labor Force | Age > 16 Comparison
Italians
Slovenes
64.6%
IN LABOR FORCE | AGE > 16
4.6/ 100
METRIC RATING
237th/ 347
METRIC RANK
64.9%
IN LABOR FORCE | AGE > 16
18.7/ 100
METRIC RATING
204th/ 347
METRIC RANK
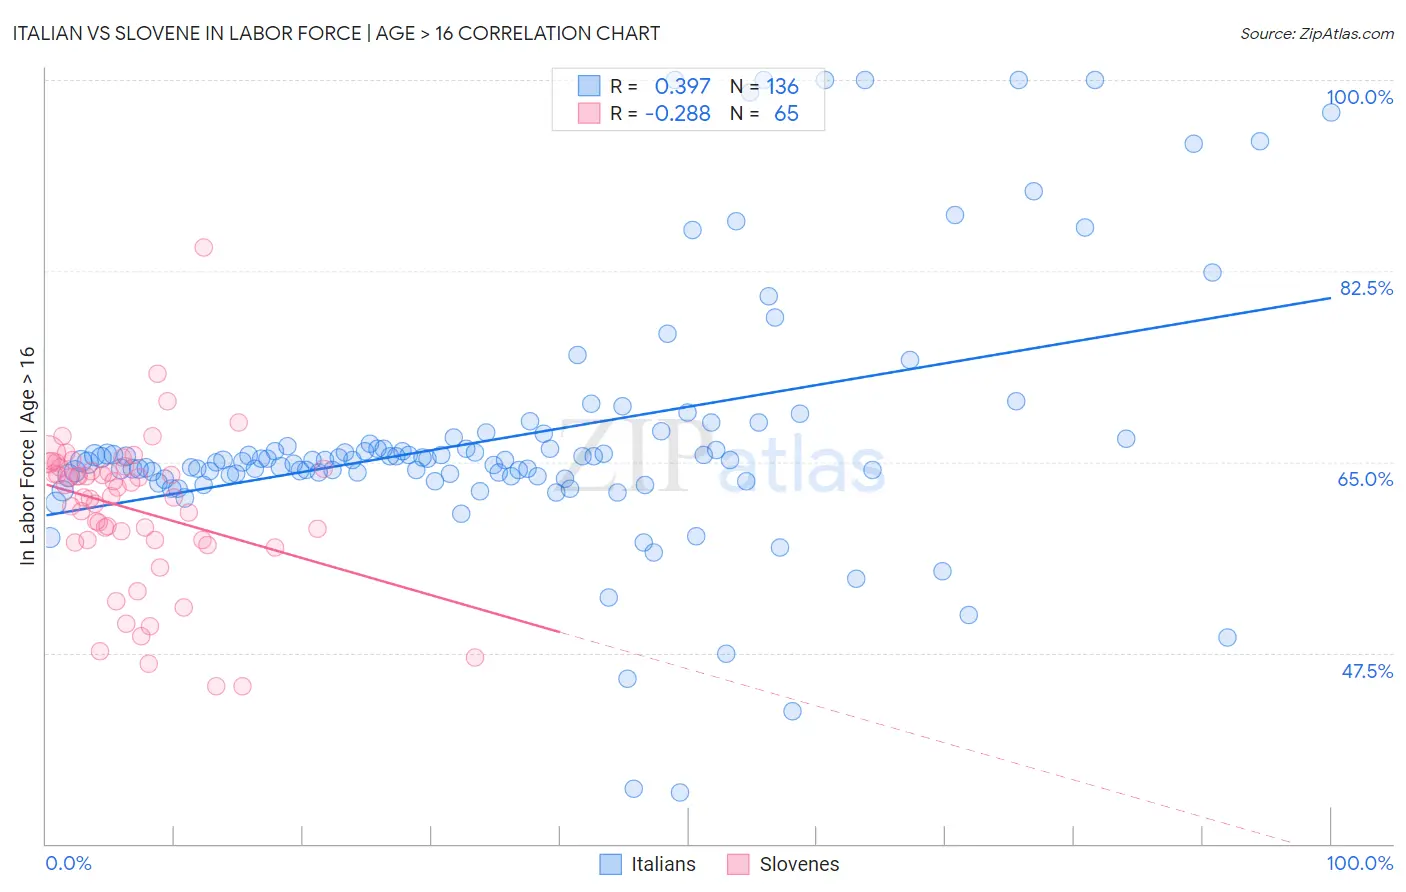
Italian vs Slovene In Labor Force | Age > 16 Correlation Chart
The statistical analysis conducted on geographies consisting of 575,110,373 people shows a mild positive correlation between the proportion of Italians and labor force participation rate among population ages 16 and over in the United States with a correlation coefficient (R) of 0.397 and weighted average of 64.6%. Similarly, the statistical analysis conducted on geographies consisting of 261,356,181 people shows a weak negative correlation between the proportion of Slovenes and labor force participation rate among population ages 16 and over in the United States with a correlation coefficient (R) of -0.288 and weighted average of 64.9%, a difference of 0.44%.
In Labor Force | Age > 16 Correlation Summary
| Measurement | Italian | Slovene |
| Minimum | 34.7% | 44.4% |
| Maximum | 100.0% | 84.6% |
| Range | 65.3% | 40.2% |
| Mean | 67.3% | 60.6% |
| Median | 65.2% | 61.9% |
| Interquartile 25% (IQ1) | 63.7% | 57.9% |
| Interquartile 75% (IQ3) | 66.9% | 64.4% |
| Interquartile Range (IQR) | 3.2% | 6.6% |
| Standard Deviation (Sample) | 11.7% | 6.9% |
| Standard Deviation (Population) | 11.7% | 6.9% |
Similar Demographics by In Labor Force | Age > 16
Demographics Similar to Italians by In Labor Force | Age > 16
In terms of in labor force | age > 16, the demographic groups most similar to Italians are Vietnamese (64.6%, a difference of 0.0%), Austrian (64.6%, a difference of 0.0%), Immigrants from Norway (64.6%, a difference of 0.0%), Slavic (64.6%, a difference of 0.020%), and Lebanese (64.5%, a difference of 0.050%).
| Demographics | Rating | Rank | In Labor Force | Age > 16 |
| Chinese | 7.3 /100 | #230 | Tragic 64.7% |
| Immigrants | Northern Europe | 7.2 /100 | #231 | Tragic 64.7% |
| Africans | 5.8 /100 | #232 | Tragic 64.6% |
| Slavs | 4.9 /100 | #233 | Tragic 64.6% |
| Vietnamese | 4.7 /100 | #234 | Tragic 64.6% |
| Austrians | 4.6 /100 | #235 | Tragic 64.6% |
| Immigrants | Norway | 4.6 /100 | #236 | Tragic 64.6% |
| Italians | 4.6 /100 | #237 | Tragic 64.6% |
| Lebanese | 3.9 /100 | #238 | Tragic 64.5% |
| Immigrants | Hungary | 3.8 /100 | #239 | Tragic 64.5% |
| Immigrants | Bangladesh | 3.6 /100 | #240 | Tragic 64.5% |
| Immigrants | Dominica | 3.5 /100 | #241 | Tragic 64.5% |
| Immigrants | Netherlands | 3.4 /100 | #242 | Tragic 64.5% |
| Immigrants | Lebanon | 3.2 /100 | #243 | Tragic 64.5% |
| Tsimshian | 3.1 /100 | #244 | Tragic 64.5% |
Demographics Similar to Slovenes by In Labor Force | Age > 16
In terms of in labor force | age > 16, the demographic groups most similar to Slovenes are Russian (64.9%, a difference of 0.0%), Jamaican (64.9%, a difference of 0.0%), Immigrants from Belgium (64.9%, a difference of 0.010%), Ukrainian (64.9%, a difference of 0.020%), and Armenian (64.9%, a difference of 0.030%).
| Demographics | Rating | Rank | In Labor Force | Age > 16 |
| Immigrants | Italy | 28.7 /100 | #197 | Fair 65.0% |
| Greeks | 26.1 /100 | #198 | Fair 64.9% |
| Mexican American Indians | 23.1 /100 | #199 | Fair 64.9% |
| Armenians | 20.2 /100 | #200 | Fair 64.9% |
| Ukrainians | 19.6 /100 | #201 | Poor 64.9% |
| Immigrants | Belgium | 19.4 /100 | #202 | Poor 64.9% |
| Russians | 18.8 /100 | #203 | Poor 64.9% |
| Slovenes | 18.7 /100 | #204 | Poor 64.9% |
| Jamaicans | 18.7 /100 | #205 | Poor 64.9% |
| Lithuanians | 17.4 /100 | #206 | Poor 64.8% |
| Immigrants | Latin America | 16.4 /100 | #207 | Poor 64.8% |
| Belizeans | 16.2 /100 | #208 | Poor 64.8% |
| Immigrants | Trinidad and Tobago | 15.6 /100 | #209 | Poor 64.8% |
| Immigrants | Denmark | 14.7 /100 | #210 | Poor 64.8% |
| Fijians | 14.1 /100 | #211 | Poor 64.8% |