British West Indian vs Yakama In Labor Force | Age 45-54
COMPARE
British West Indian
Yakama
In Labor Force | Age 45-54
In Labor Force | Age 45-54 Comparison
British West Indians
Yakama
81.2%
IN LABOR FORCE | AGE 45-54
0.0/ 100
METRIC RATING
274th/ 347
METRIC RANK
80.6%
IN LABOR FORCE | AGE 45-54
0.0/ 100
METRIC RATING
294th/ 347
METRIC RANK
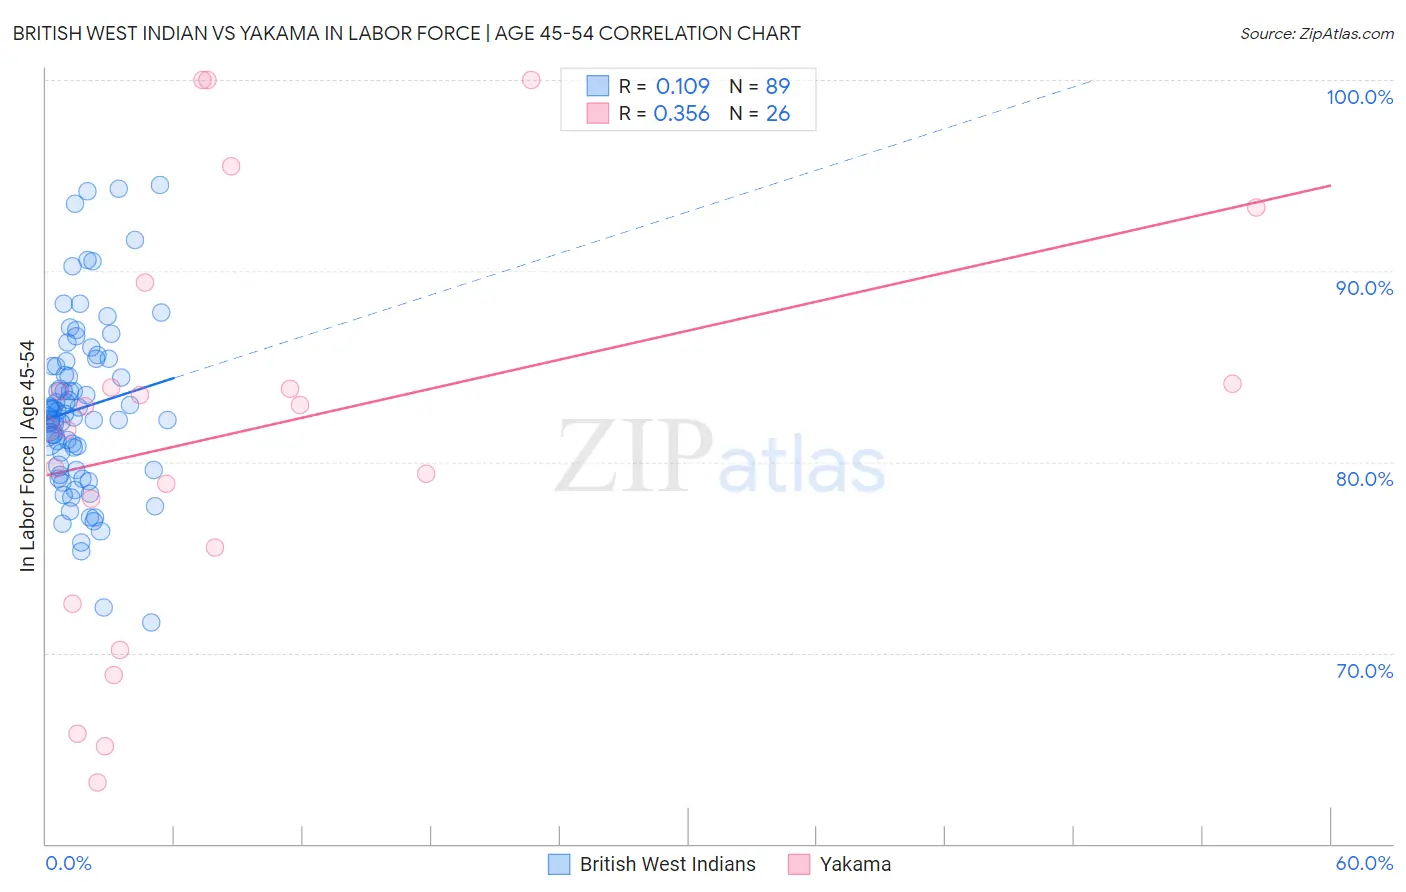
British West Indian vs Yakama In Labor Force | Age 45-54 Correlation Chart
The statistical analysis conducted on geographies consisting of 152,595,623 people shows a poor positive correlation between the proportion of British West Indians and labor force participation rate among population between the ages 45 and 54 in the United States with a correlation coefficient (R) of 0.109 and weighted average of 81.2%. Similarly, the statistical analysis conducted on geographies consisting of 19,917,759 people shows a mild positive correlation between the proportion of Yakama and labor force participation rate among population between the ages 45 and 54 in the United States with a correlation coefficient (R) of 0.356 and weighted average of 80.6%, a difference of 0.79%.
In Labor Force | Age 45-54 Correlation Summary
| Measurement | British West Indian | Yakama |
| Minimum | 71.6% | 63.2% |
| Maximum | 94.5% | 100.0% |
| Range | 22.9% | 36.8% |
| Mean | 82.8% | 81.7% |
| Median | 82.5% | 82.3% |
| Interquartile 25% (IQ1) | 79.7% | 75.5% |
| Interquartile 75% (IQ3) | 85.2% | 84.1% |
| Interquartile Range (IQR) | 5.5% | 8.6% |
| Standard Deviation (Sample) | 4.5% | 10.5% |
| Standard Deviation (Population) | 4.5% | 10.3% |
Demographics Similar to British West Indians and Yakama by In Labor Force | Age 45-54
In terms of in labor force | age 45-54, the demographic groups most similar to British West Indians are Nonimmigrants (81.2%, a difference of 0.010%), U.S. Virgin Islander (81.2%, a difference of 0.050%), Guatemalan (81.2%, a difference of 0.070%), Immigrants from Guatemala (81.1%, a difference of 0.15%), and Immigrants from Micronesia (81.1%, a difference of 0.16%). Similarly, the demographic groups most similar to Yakama are Osage (80.6%, a difference of 0.0%), Iroquois (80.6%, a difference of 0.020%), Immigrants from Belize (80.6%, a difference of 0.050%), Mexican American Indian (80.7%, a difference of 0.15%), and Immigrants from Bangladesh (80.7%, a difference of 0.18%).
| Demographics | Rating | Rank | In Labor Force | Age 45-54 |
| British West Indians | 0.0 /100 | #274 | Tragic 81.2% |
| Immigrants | Nonimmigrants | 0.0 /100 | #275 | Tragic 81.2% |
| U.S. Virgin Islanders | 0.0 /100 | #276 | Tragic 81.2% |
| Guatemalans | 0.0 /100 | #277 | Tragic 81.2% |
| Immigrants | Guatemala | 0.0 /100 | #278 | Tragic 81.1% |
| Immigrants | Micronesia | 0.0 /100 | #279 | Tragic 81.1% |
| Immigrants | Latin America | 0.0 /100 | #280 | Tragic 81.0% |
| Immigrants | Grenada | 0.0 /100 | #281 | Tragic 81.0% |
| Aleuts | 0.0 /100 | #282 | Tragic 81.0% |
| French American Indians | 0.0 /100 | #283 | Tragic 80.8% |
| Belizeans | 0.0 /100 | #284 | Tragic 80.8% |
| Delaware | 0.0 /100 | #285 | Tragic 80.8% |
| Immigrants | Dominica | 0.0 /100 | #286 | Tragic 80.8% |
| Vietnamese | 0.0 /100 | #287 | Tragic 80.8% |
| Cree | 0.0 /100 | #288 | Tragic 80.8% |
| Immigrants | Bangladesh | 0.0 /100 | #289 | Tragic 80.7% |
| Mexican American Indians | 0.0 /100 | #290 | Tragic 80.7% |
| Immigrants | Belize | 0.0 /100 | #291 | Tragic 80.6% |
| Iroquois | 0.0 /100 | #292 | Tragic 80.6% |
| Osage | 0.0 /100 | #293 | Tragic 80.6% |
| Yakama | 0.0 /100 | #294 | Tragic 80.6% |