Iranian vs Immigrants from El Salvador In Labor Force | Age 45-54
COMPARE
Iranian
Immigrants from El Salvador
In Labor Force | Age 45-54
In Labor Force | Age 45-54 Comparison
Iranians
Immigrants from El Salvador
83.2%
IN LABOR FORCE | AGE 45-54
92.9/ 100
METRIC RATING
107th/ 347
METRIC RANK
81.9%
IN LABOR FORCE | AGE 45-54
1.0/ 100
METRIC RATING
240th/ 347
METRIC RANK
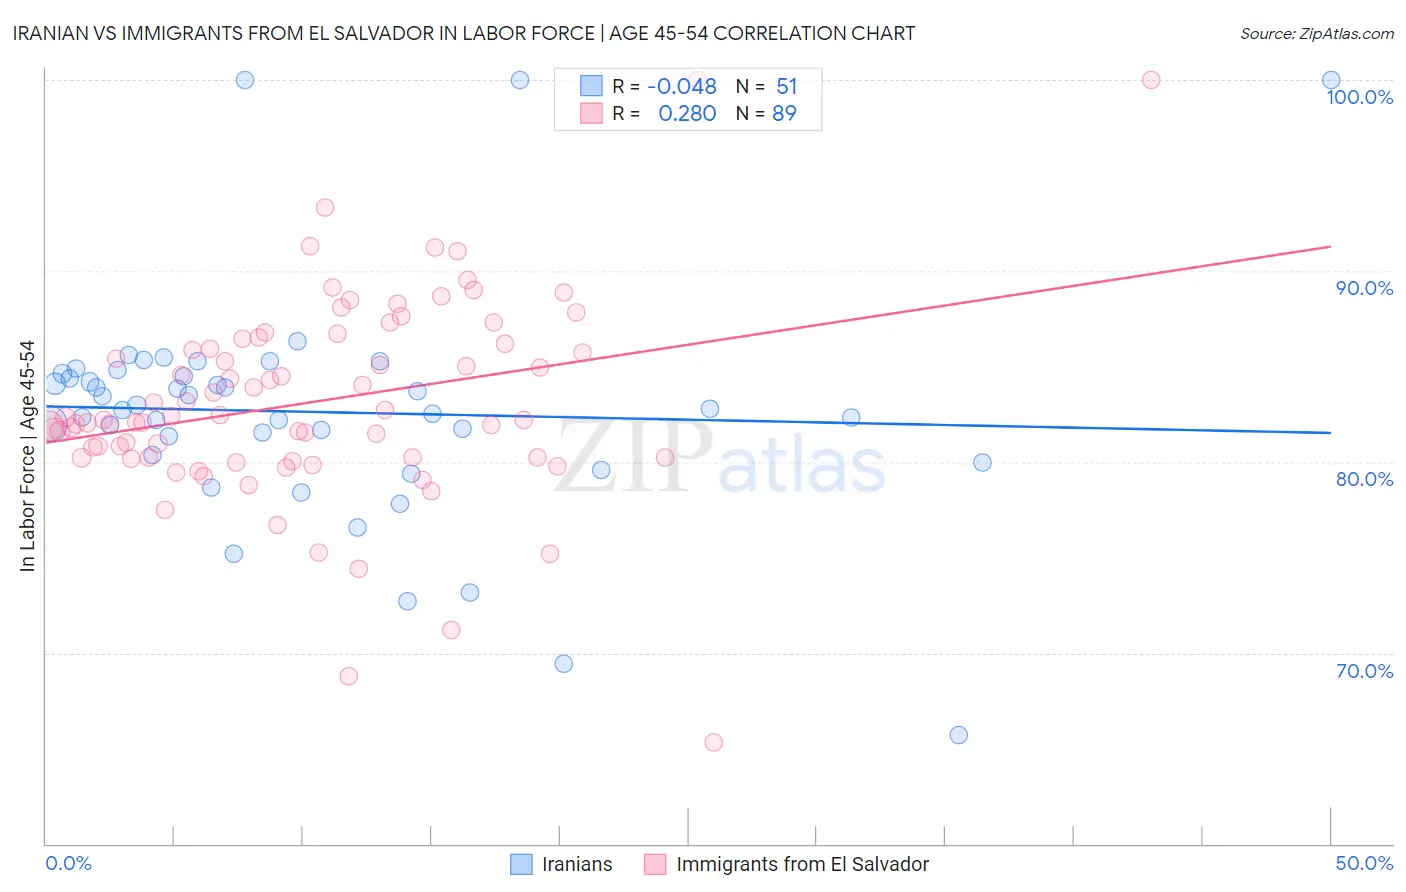
Iranian vs Immigrants from El Salvador In Labor Force | Age 45-54 Correlation Chart
The statistical analysis conducted on geographies consisting of 316,652,476 people shows no correlation between the proportion of Iranians and labor force participation rate among population between the ages 45 and 54 in the United States with a correlation coefficient (R) of -0.048 and weighted average of 83.2%. Similarly, the statistical analysis conducted on geographies consisting of 357,696,462 people shows a weak positive correlation between the proportion of Immigrants from El Salvador and labor force participation rate among population between the ages 45 and 54 in the United States with a correlation coefficient (R) of 0.280 and weighted average of 81.9%, a difference of 1.6%.
In Labor Force | Age 45-54 Correlation Summary
| Measurement | Iranian | Immigrants from El Salvador |
| Minimum | 65.7% | 65.3% |
| Maximum | 100.0% | 100.0% |
| Range | 34.3% | 34.7% |
| Mean | 82.6% | 83.1% |
| Median | 82.8% | 82.2% |
| Interquartile 25% (IQ1) | 80.4% | 80.2% |
| Interquartile 75% (IQ3) | 84.6% | 86.3% |
| Interquartile Range (IQR) | 4.3% | 6.1% |
| Standard Deviation (Sample) | 6.1% | 5.3% |
| Standard Deviation (Population) | 6.0% | 5.3% |
Similar Demographics by In Labor Force | Age 45-54
Demographics Similar to Iranians by In Labor Force | Age 45-54
In terms of in labor force | age 45-54, the demographic groups most similar to Iranians are Slovak (83.2%, a difference of 0.0%), Sri Lankan (83.2%, a difference of 0.010%), Ukrainian (83.2%, a difference of 0.010%), Immigrants from Africa (83.2%, a difference of 0.010%), and Immigrants from Italy (83.2%, a difference of 0.010%).
| Demographics | Rating | Rank | In Labor Force | Age 45-54 |
| Mongolians | 94.2 /100 | #100 | Exceptional 83.3% |
| Immigrants | Belarus | 94.1 /100 | #101 | Exceptional 83.3% |
| Immigrants | Singapore | 93.9 /100 | #102 | Exceptional 83.3% |
| Albanians | 93.9 /100 | #103 | Exceptional 83.3% |
| Immigrants | Romania | 93.8 /100 | #104 | Exceptional 83.3% |
| Immigrants | South America | 93.5 /100 | #105 | Exceptional 83.2% |
| Sri Lankans | 93.2 /100 | #106 | Exceptional 83.2% |
| Iranians | 92.9 /100 | #107 | Exceptional 83.2% |
| Slovaks | 92.8 /100 | #108 | Exceptional 83.2% |
| Ukrainians | 92.7 /100 | #109 | Exceptional 83.2% |
| Immigrants | Africa | 92.6 /100 | #110 | Exceptional 83.2% |
| Immigrants | Italy | 92.5 /100 | #111 | Exceptional 83.2% |
| Immigrants | Afghanistan | 92.4 /100 | #112 | Exceptional 83.2% |
| Immigrants | Albania | 91.8 /100 | #113 | Exceptional 83.2% |
| Assyrians/Chaldeans/Syriacs | 91.7 /100 | #114 | Exceptional 83.2% |
Demographics Similar to Immigrants from El Salvador by In Labor Force | Age 45-54
In terms of in labor force | age 45-54, the demographic groups most similar to Immigrants from El Salvador are Immigrants from Thailand (81.9%, a difference of 0.010%), Trinidadian and Tobagonian (81.9%, a difference of 0.030%), Immigrants from Trinidad and Tobago (82.0%, a difference of 0.040%), Subsaharan African (82.0%, a difference of 0.050%), and Basque (82.0%, a difference of 0.050%).
| Demographics | Rating | Rank | In Labor Force | Age 45-54 |
| Malaysians | 1.7 /100 | #233 | Tragic 82.0% |
| Salvadorans | 1.7 /100 | #234 | Tragic 82.0% |
| Sub-Saharan Africans | 1.2 /100 | #235 | Tragic 82.0% |
| Basques | 1.2 /100 | #236 | Tragic 82.0% |
| Immigrants | Trinidad and Tobago | 1.2 /100 | #237 | Tragic 82.0% |
| Trinidadians and Tobagonians | 1.1 /100 | #238 | Tragic 81.9% |
| Immigrants | Thailand | 1.0 /100 | #239 | Tragic 81.9% |
| Immigrants | El Salvador | 1.0 /100 | #240 | Tragic 81.9% |
| Immigrants | Cambodia | 0.8 /100 | #241 | Tragic 81.9% |
| Whites/Caucasians | 0.7 /100 | #242 | Tragic 81.9% |
| Samoans | 0.6 /100 | #243 | Tragic 81.8% |
| Celtics | 0.4 /100 | #244 | Tragic 81.8% |
| Alaska Natives | 0.4 /100 | #245 | Tragic 81.8% |
| Alaskan Athabascans | 0.4 /100 | #246 | Tragic 81.8% |
| Central Americans | 0.4 /100 | #247 | Tragic 81.7% |