Immigrants from Asia vs Yakama In Labor Force | Age 45-54

COMPARE

Immigrants from Asia
Race
Ancestry
AfghanAfricanAlaska NativeAlaskan AthabascanAlbanianAleutAlsatianAmericanApacheArabArapahoArgentineanArmenianAssyrian/Chaldean/SyriacAustralianAustrianBahamianBangladeshiBarbadianBasqueBelgianBelizeanBermudanBhutaneseBlackfeetBolivianBrazilianBritishBritish West IndianBulgarianBurmeseCajunCambodianCanadianCape VerdeanCarpatho RusynCelticCentral AmericanCentral American IndianCherokeeCheyenneChickasawChileanChineseChippewaChoctawColombianColvilleComancheCosta RicanCreeCreekCroatianCrowCubanCypriotCzechCzechoslovakianDanishDelawareDominicanDutchDutch West IndianEastern EuropeanEcuadorianEgyptianEnglishEstonianEthiopianEuropeanFijianFilipinoFinnishFrenchFrench American IndianFrench CanadianGermanGerman RussianGhanaianGreekGuamanian/ChamorroGuatemalanGuyaneseHaitianHmongHonduranHopiHoumaHungarianIcelanderIndian (Asian)IndonesianInupiatIranianIraqiIrishIroquoisIsraeliItalianJamaicanJapaneseJordanianKenyanKiowaKoreanLaotianLatvianLebaneseLiberianLithuanianLumbeeLuxembourgerMacedonianMalaysianMalteseMarshalleseMenomineeMexicanMexican American IndianMongolianMoroccanNative HawaiianNavajoNepaleseNew ZealanderNicaraguanNigerianNorthern EuropeanNorwegianOkinawanOsageOttawaPaiutePakistaniPalestinianPanamanianParaguayanPennsylvania GermanPeruvianPimaPolishPortuguesePotawatomiPuebloPuerto RicanPuget Sound SalishRomanianRussianSalvadoranSamoanScandinavianScotch-IrishScottishSeminoleSenegaleseSerbianShoshoneSierra LeoneanSiouxSlavicSlovakSloveneSomaliSouth AfricanSouth AmericanSouth American IndianSoviet UnionSpaniardSpanishSpanish AmericanSpanish American IndianSri LankanSubsaharan AfricanSudaneseSwedishSwissSyrianTaiwaneseThaiTlingit-HaidaTohono O'OdhamTonganTrinidadian and TobagonianTsimshianTurkishU.S. Virgin IslanderUgandanUkrainianUruguayanUteVenezuelanVietnameseWelshWest IndianYaquiYugoslavianYumanYup'ikZimbabwean
Immigration
NonimmigrantsImmigrantsAfghanistanAfricaAlbaniaArgentinaArmeniaAsiaAustraliaAustriaBahamasBangladeshBarbadosBelarusBelgiumBelizeBoliviaBosnia and HerzegovinaBrazilBulgariaBurma/MyanmarCabo VerdeCambodiaCameroonCanadaCaribbeanCentral AmericaChileChinaColombiaCongoCosta RicaCroatiaCubaCzechoslovakiaDenmarkDominicaDominican RepublicEastern AfricaEastern AsiaEastern EuropeEcuadorEgyptEl SalvadorEnglandEritreaEthiopiaEuropeFijiFranceGermanyGhanaGreeceGrenadaGuatemalaGuyanaHaitiHondurasHong KongHungaryIndiaIndonesiaIranIraqIrelandIsraelItalyJamaicaJapanJordanKazakhstanKenyaKoreaKuwaitLaosLatin AmericaLatviaLebanonLiberiaLithuaniaMalaysiaMexicoMicronesiaMiddle AfricaMoldovaMoroccoNepalNetherlandsNicaraguaNigeriaNorth AmericaNorth MacedoniaNorthern AfricaNorthern EuropeNorwayOceaniaPakistanPanamaPeruPhilippinesPolandPortugalRomaniaRussiaSaudi ArabiaScotlandSenegalSerbiaSierra LeoneSingaporeSomaliaSouth AfricaSouth AmericaSouth Central AsiaSouth Eastern AsiaSouthern EuropeSpainSri LankaSt. Vincent and the GrenadinesSudanSwedenSwitzerlandSyriaTaiwanThailandTrinidad and TobagoTurkeyUgandaUkraineUruguayUzbekistanVenezuelaVietnamWest IndiesWestern AfricaWestern AsiaWestern EuropeYemenZaireZimbabweAzores
Yakama
Race
Ancestry
AfghanAfricanAlaska NativeAlaskan AthabascanAlbanianAleutAlsatianAmericanApacheArabArapahoArgentineanArmenianAssyrian/Chaldean/SyriacAustralianAustrianBahamianBangladeshiBarbadianBasqueBelgianBelizeanBermudanBhutaneseBlackfeetBolivianBrazilianBritishBritish West IndianBulgarianBurmeseCajunCambodianCanadianCape VerdeanCarpatho RusynCelticCentral AmericanCentral American IndianCherokeeCheyenneChickasawChileanChineseChippewaChoctawColombianColvilleComancheCosta RicanCreeCreekCroatianCrowCubanCypriotCzechCzechoslovakianDanishDelawareDominicanDutchDutch West IndianEastern EuropeanEcuadorianEgyptianEnglishEstonianEthiopianEuropeanFijianFilipinoFinnishFrenchFrench American IndianFrench CanadianGermanGerman RussianGhanaianGreekGuamanian/ChamorroGuatemalanGuyaneseHaitianHmongHonduranHopiHoumaHungarianIcelanderIndian (Asian)IndonesianInupiatIranianIraqiIrishIroquoisIsraeliItalianJamaicanJapaneseJordanianKenyanKiowaKoreanLaotianLatvianLebaneseLiberianLithuanianLumbeeLuxembourgerMacedonianMalaysianMalteseMarshalleseMenomineeMexicanMexican American IndianMongolianMoroccanNative HawaiianNavajoNepaleseNew ZealanderNicaraguanNigerianNorthern EuropeanNorwegianOkinawanOsageOttawaPaiutePakistaniPalestinianPanamanianParaguayanPennsylvania GermanPeruvianPimaPolishPortuguesePotawatomiPuebloPuerto RicanPuget Sound SalishRomanianRussianSalvadoranSamoanScandinavianScotch-IrishScottishSeminoleSenegaleseSerbianShoshoneSierra LeoneanSiouxSlavicSlovakSloveneSomaliSouth AfricanSouth AmericanSouth American IndianSoviet UnionSpaniardSpanishSpanish AmericanSpanish American IndianSri LankanSubsaharan AfricanSudaneseSwedishSwissSyrianTaiwaneseThaiTlingit-HaidaTohono O'OdhamTonganTrinidadian and TobagonianTsimshianTurkishU.S. Virgin IslanderUgandanUkrainianUruguayanUteVenezuelanVietnameseWelshWest IndianYakamaYaquiYugoslavianYumanYup'ikZimbabwean
Immigration
NonimmigrantsImmigrantsAfghanistanAfricaAlbaniaArgentinaArmeniaAustraliaAustriaBahamasBangladeshBarbadosBelarusBelgiumBelizeBoliviaBosnia and HerzegovinaBrazilBulgariaBurma/MyanmarCabo VerdeCambodiaCameroonCanadaCaribbeanCentral AmericaChileChinaColombiaCongoCosta RicaCroatiaCubaCzechoslovakiaDenmarkDominicaDominican RepublicEastern AfricaEastern AsiaEastern EuropeEcuadorEgyptEl SalvadorEnglandEritreaEthiopiaEuropeFijiFranceGermanyGhanaGreeceGrenadaGuatemalaGuyanaHaitiHondurasHong KongHungaryIndiaIndonesiaIranIraqIrelandIsraelItalyJamaicaJapanJordanKazakhstanKenyaKoreaKuwaitLaosLatin AmericaLatviaLebanonLiberiaLithuaniaMalaysiaMexicoMicronesiaMiddle AfricaMoldovaMoroccoNepalNetherlandsNicaraguaNigeriaNorth AmericaNorth MacedoniaNorthern AfricaNorthern EuropeNorwayOceaniaPakistanPanamaPeruPhilippinesPolandPortugalRomaniaRussiaSaudi ArabiaScotlandSenegalSerbiaSierra LeoneSingaporeSomaliaSouth AfricaSouth AmericaSouth Central AsiaSouth Eastern AsiaSouthern EuropeSpainSri LankaSt. Vincent and the GrenadinesSudanSwedenSwitzerlandSyriaTaiwanThailandTrinidad and TobagoTurkeyUgandaUkraineUruguayUzbekistanVenezuelaVietnamWest IndiesWestern AfricaWestern AsiaWestern EuropeYemenZaireZimbabweAzores
In Labor Force | Age 45-54
Income
Poverty
Unemployment
Labor Participation
Family Structure
Vehicle Availability
Education Level
Disability

In Labor Force | Age 45-54 Comparison

Immigrants from Asia

Yakama

Exceptional
Tragic
83.3%
IN LABOR FORCE | AGE 45-54
95.6/ 100
METRIC RATING
88th/ 347
METRIC RANK
80.6%
IN LABOR FORCE | AGE 45-54
0.0/ 100
METRIC RATING
294th/ 347
METRIC RANK

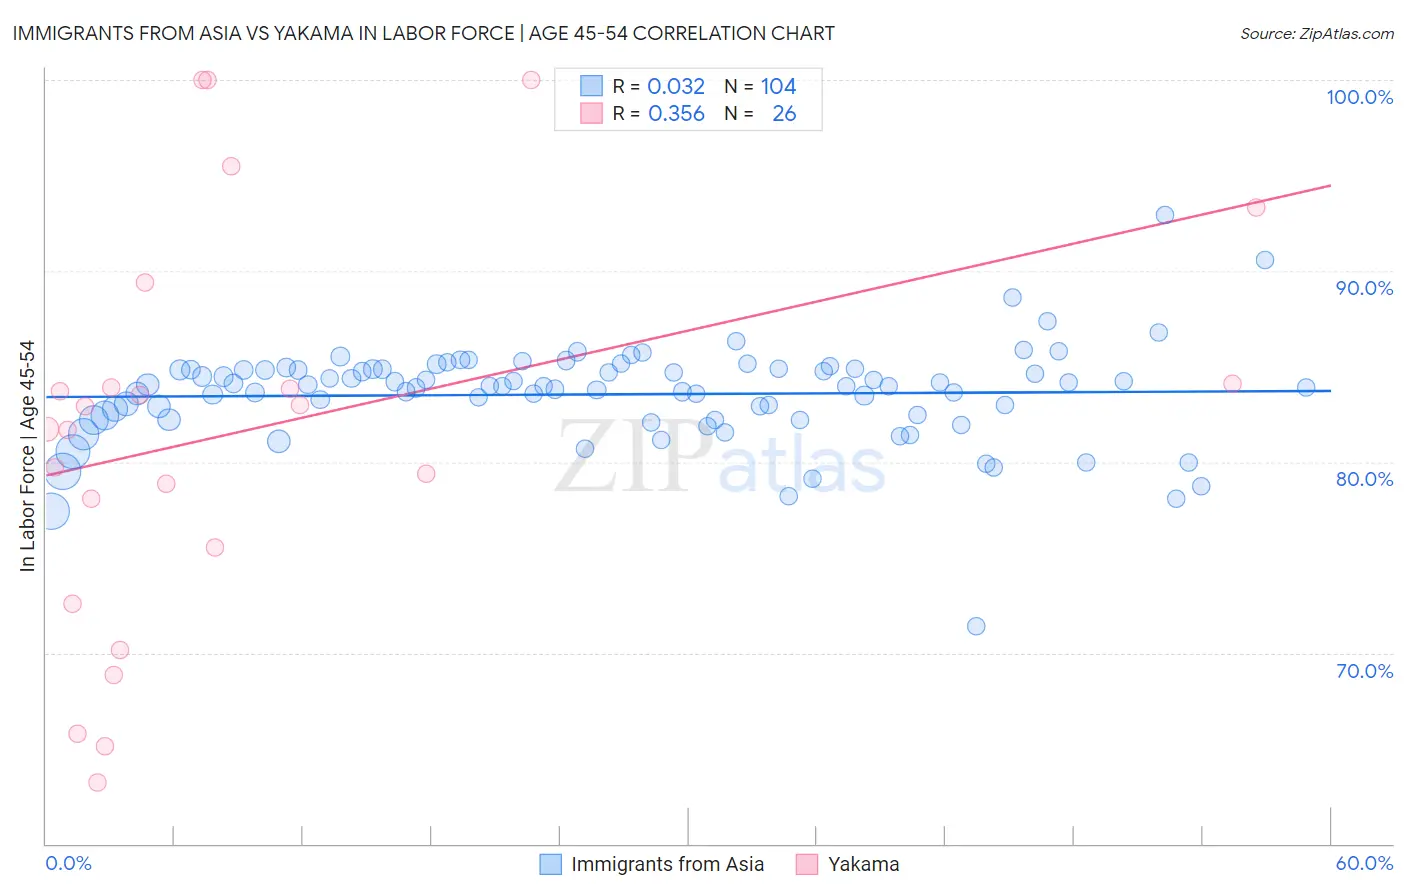
Immigrants from Asia vs Yakama In Labor Force | Age 45-54 Correlation Chart

The statistical analysis conducted on geographies consisting of 548,472,608 people shows no correlation between the proportion of Immigrants from Asia and labor force participation rate among population between the ages 45 and 54 in the United States with a correlation coefficient (R) of 0.032 and weighted average of 83.3%. Similarly, the statistical analysis conducted on geographies consisting of 19,917,759 people shows a mild positive correlation between the proportion of Yakama and labor force participation rate among population between the ages 45 and 54 in the United States with a correlation coefficient (R) of 0.356 and weighted average of 80.6%, a difference of 3.4%.
Immigrants from Asia vs Yakama In Labor Force | Age 45-54

In Labor Force | Age 45-54 Correlation Summary

MeasurementImmigrants from AsiaYakama
Minimum71.4%63.2%
Maximum92.9%100.0%
Range21.5%36.8%
Mean83.5%81.7%
Median84.0%82.3%
Interquartile 25% (IQ1)82.3%75.5%
Interquartile 75% (IQ3)84.8%84.1%
Interquartile Range (IQR)2.5%8.6%
Standard Deviation (Sample)2.6%10.5%
Standard Deviation (Population)2.6%10.3%

Similar Demographics by In Labor Force | Age 45-54

Demographics Similar to Immigrants from Asia by In Labor Force | Age 45-54

In terms of in labor force | age 45-54, the demographic groups most similar to Immigrants from Asia are Immigrants from Eastern Europe (83.3%, a difference of 0.0%), Indian (Asian) (83.3%, a difference of 0.0%), Immigrants from Japan (83.3%, a difference of 0.0%), South American (83.3%, a difference of 0.0%), and Immigrants from Northern Africa (83.3%, a difference of 0.010%).
DemographicsRating | RankIn Labor Force | Age 45-54
Jordanians
96.4
/100
|
#81
Exceptional
83.4%
Immigrants | Eastern Asia
96.3
/100
|
#82
Exceptional
83.4%
Immigrants | Zimbabwe
96.3
/100
|
#83
Exceptional
83.4%
Immigrants | Bosnia and Herzegovina
96.0
/100
|
#84
Exceptional
83.3%
Greeks
95.9
/100
|
#85
Exceptional
83.3%
Immigrants | Northern Africa
95.7
/100
|
#86
Exceptional
83.3%
Immigrants | Eastern Europe
95.6
/100
|
#87
Exceptional
83.3%
Immigrants | Asia
95.6
/100
|
#88
Exceptional
83.3%
Indians (Asian)
95.5
/100
|
#89
Exceptional
83.3%
Immigrants | Japan
95.5
/100
|
#90
Exceptional
83.3%
South Americans
95.5
/100
|
#91
Exceptional
83.3%
Danes
95.3
/100
|
#92
Exceptional
83.3%
Italians
95.1
/100
|
#93
Exceptional
83.3%
Argentineans
94.9
/100
|
#94
Exceptional
83.3%
Immigrants | Argentina
94.9
/100
|
#95
Exceptional
83.3%

Demographics Similar to Yakama by In Labor Force | Age 45-54

In terms of in labor force | age 45-54, the demographic groups most similar to Yakama are Osage (80.6%, a difference of 0.0%), Iroquois (80.6%, a difference of 0.020%), Immigrants from Belize (80.6%, a difference of 0.050%), Nepalese (80.5%, a difference of 0.070%), and African (80.5%, a difference of 0.10%).
DemographicsRating | RankIn Labor Force | Age 45-54
Vietnamese
0.0
/100
|
#287
Tragic
80.8%
Cree
0.0
/100
|
#288
Tragic
80.8%
Immigrants | Bangladesh
0.0
/100
|
#289
Tragic
80.7%
Mexican American Indians
0.0
/100
|
#290
Tragic
80.7%
Immigrants | Belize
0.0
/100
|
#291
Tragic
80.6%
Iroquois
0.0
/100
|
#292
Tragic
80.6%
Osage
0.0
/100
|
#293
Tragic
80.6%
Yakama
0.0
/100
|
#294
Tragic
80.6%
Nepalese
0.0
/100
|
#295
Tragic
80.5%
Africans
0.0
/100
|
#296
Tragic
80.5%
Americans
0.0
/100
|
#297
Tragic
80.4%
Marshallese
0.0
/100
|
#298
Tragic
80.3%
Dominicans
0.0
/100
|
#299
Tragic
80.3%
Fijians
0.0
/100
|
#300
Tragic
80.2%
Spanish American Indians
0.0
/100
|
#301
Tragic
80.2%