Iranian vs Japanese In Labor Force | Age 45-54
COMPARE
Iranian
Japanese
In Labor Force | Age 45-54
In Labor Force | Age 45-54 Comparison
Iranians
Japanese
83.2%
IN LABOR FORCE | AGE 45-54
92.9/ 100
METRIC RATING
107th/ 347
METRIC RANK
81.6%
IN LABOR FORCE | AGE 45-54
0.2/ 100
METRIC RATING
253rd/ 347
METRIC RANK
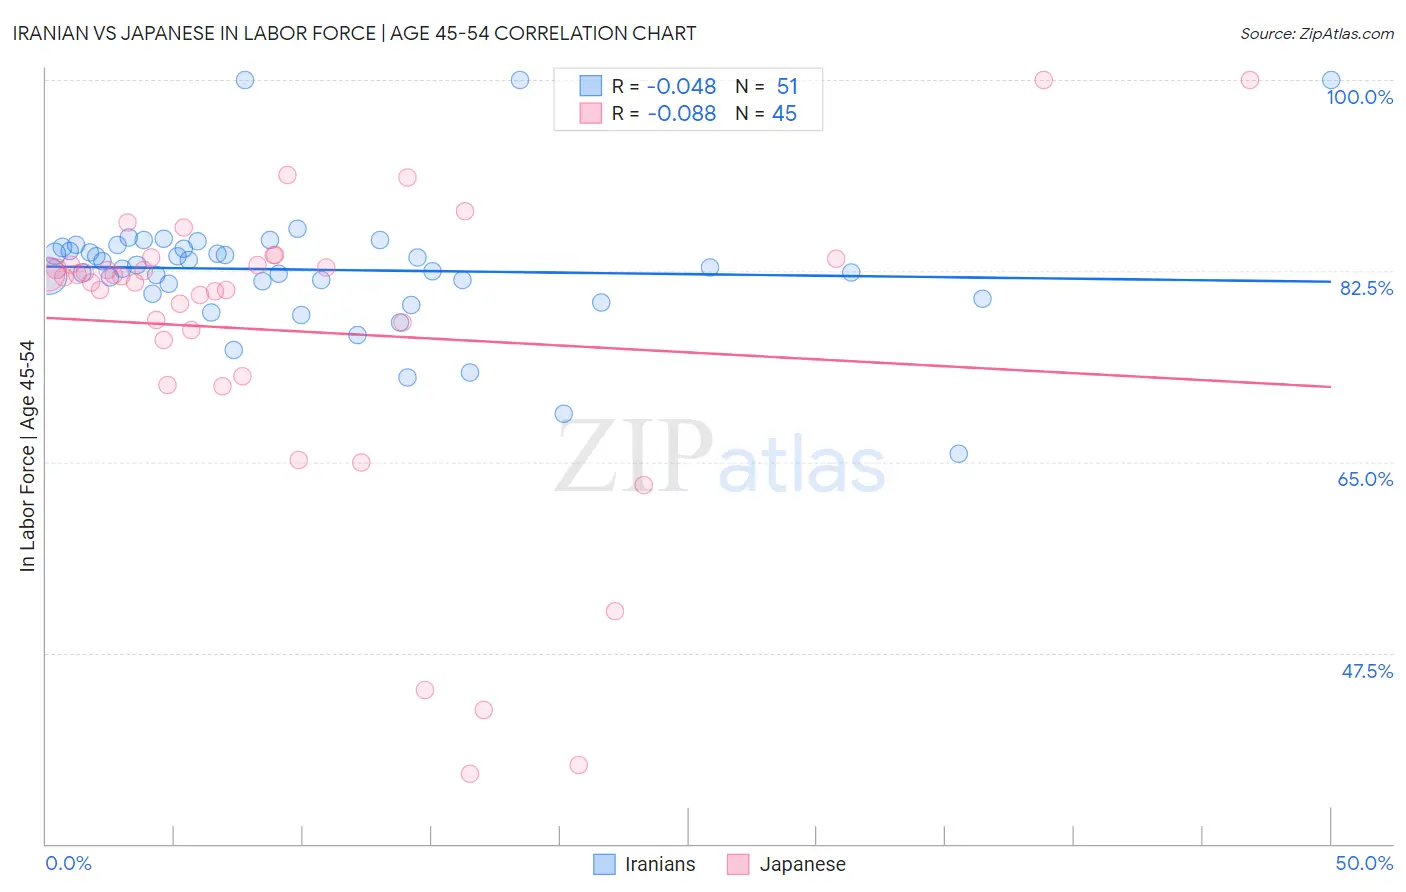
Iranian vs Japanese In Labor Force | Age 45-54 Correlation Chart
The statistical analysis conducted on geographies consisting of 316,652,476 people shows no correlation between the proportion of Iranians and labor force participation rate among population between the ages 45 and 54 in the United States with a correlation coefficient (R) of -0.048 and weighted average of 83.2%. Similarly, the statistical analysis conducted on geographies consisting of 249,074,736 people shows a slight negative correlation between the proportion of Japanese and labor force participation rate among population between the ages 45 and 54 in the United States with a correlation coefficient (R) of -0.088 and weighted average of 81.6%, a difference of 2.0%.
In Labor Force | Age 45-54 Correlation Summary
| Measurement | Iranian | Japanese |
| Minimum | 65.7% | 36.4% |
| Maximum | 100.0% | 100.0% |
| Range | 34.3% | 63.6% |
| Mean | 82.6% | 77.0% |
| Median | 82.8% | 81.9% |
| Interquartile 25% (IQ1) | 80.4% | 74.5% |
| Interquartile 75% (IQ3) | 84.6% | 83.3% |
| Interquartile Range (IQR) | 4.3% | 8.8% |
| Standard Deviation (Sample) | 6.1% | 14.4% |
| Standard Deviation (Population) | 6.0% | 14.3% |
Similar Demographics by In Labor Force | Age 45-54
Demographics Similar to Iranians by In Labor Force | Age 45-54
In terms of in labor force | age 45-54, the demographic groups most similar to Iranians are Slovak (83.2%, a difference of 0.0%), Sri Lankan (83.2%, a difference of 0.010%), Ukrainian (83.2%, a difference of 0.010%), Immigrants from Africa (83.2%, a difference of 0.010%), and Immigrants from Italy (83.2%, a difference of 0.010%).
| Demographics | Rating | Rank | In Labor Force | Age 45-54 |
| Mongolians | 94.2 /100 | #100 | Exceptional 83.3% |
| Immigrants | Belarus | 94.1 /100 | #101 | Exceptional 83.3% |
| Immigrants | Singapore | 93.9 /100 | #102 | Exceptional 83.3% |
| Albanians | 93.9 /100 | #103 | Exceptional 83.3% |
| Immigrants | Romania | 93.8 /100 | #104 | Exceptional 83.3% |
| Immigrants | South America | 93.5 /100 | #105 | Exceptional 83.2% |
| Sri Lankans | 93.2 /100 | #106 | Exceptional 83.2% |
| Iranians | 92.9 /100 | #107 | Exceptional 83.2% |
| Slovaks | 92.8 /100 | #108 | Exceptional 83.2% |
| Ukrainians | 92.7 /100 | #109 | Exceptional 83.2% |
| Immigrants | Africa | 92.6 /100 | #110 | Exceptional 83.2% |
| Immigrants | Italy | 92.5 /100 | #111 | Exceptional 83.2% |
| Immigrants | Afghanistan | 92.4 /100 | #112 | Exceptional 83.2% |
| Immigrants | Albania | 91.8 /100 | #113 | Exceptional 83.2% |
| Assyrians/Chaldeans/Syriacs | 91.7 /100 | #114 | Exceptional 83.2% |
Demographics Similar to Japanese by In Labor Force | Age 45-54
In terms of in labor force | age 45-54, the demographic groups most similar to Japanese are Immigrants from Laos (81.6%, a difference of 0.010%), Scotch-Irish (81.6%, a difference of 0.020%), Pennsylvania German (81.6%, a difference of 0.030%), Guamanian/Chamorro (81.6%, a difference of 0.040%), and Barbadian (81.6%, a difference of 0.050%).
| Demographics | Rating | Rank | In Labor Force | Age 45-54 |
| Alaskan Athabascans | 0.4 /100 | #246 | Tragic 81.8% |
| Central Americans | 0.4 /100 | #247 | Tragic 81.7% |
| Puget Sound Salish | 0.3 /100 | #248 | Tragic 81.7% |
| Hmong | 0.3 /100 | #249 | Tragic 81.7% |
| Immigrants | Armenia | 0.2 /100 | #250 | Tragic 81.7% |
| Guamanians/Chamorros | 0.2 /100 | #251 | Tragic 81.6% |
| Pennsylvania Germans | 0.2 /100 | #252 | Tragic 81.6% |
| Japanese | 0.2 /100 | #253 | Tragic 81.6% |
| Immigrants | Laos | 0.2 /100 | #254 | Tragic 81.6% |
| Scotch-Irish | 0.2 /100 | #255 | Tragic 81.6% |
| Barbadians | 0.1 /100 | #256 | Tragic 81.6% |
| Immigrants | Congo | 0.1 /100 | #257 | Tragic 81.6% |
| Immigrants | Fiji | 0.1 /100 | #258 | Tragic 81.5% |
| Guyanese | 0.1 /100 | #259 | Tragic 81.5% |
| Spaniards | 0.1 /100 | #260 | Tragic 81.5% |