Iranian vs Navajo In Labor Force | Age 45-54
COMPARE
Iranian
Navajo
In Labor Force | Age 45-54
In Labor Force | Age 45-54 Comparison
Iranians
Navajo
83.2%
IN LABOR FORCE | AGE 45-54
92.9/ 100
METRIC RATING
107th/ 347
METRIC RANK
72.8%
IN LABOR FORCE | AGE 45-54
0.0/ 100
METRIC RATING
347th/ 347
METRIC RANK
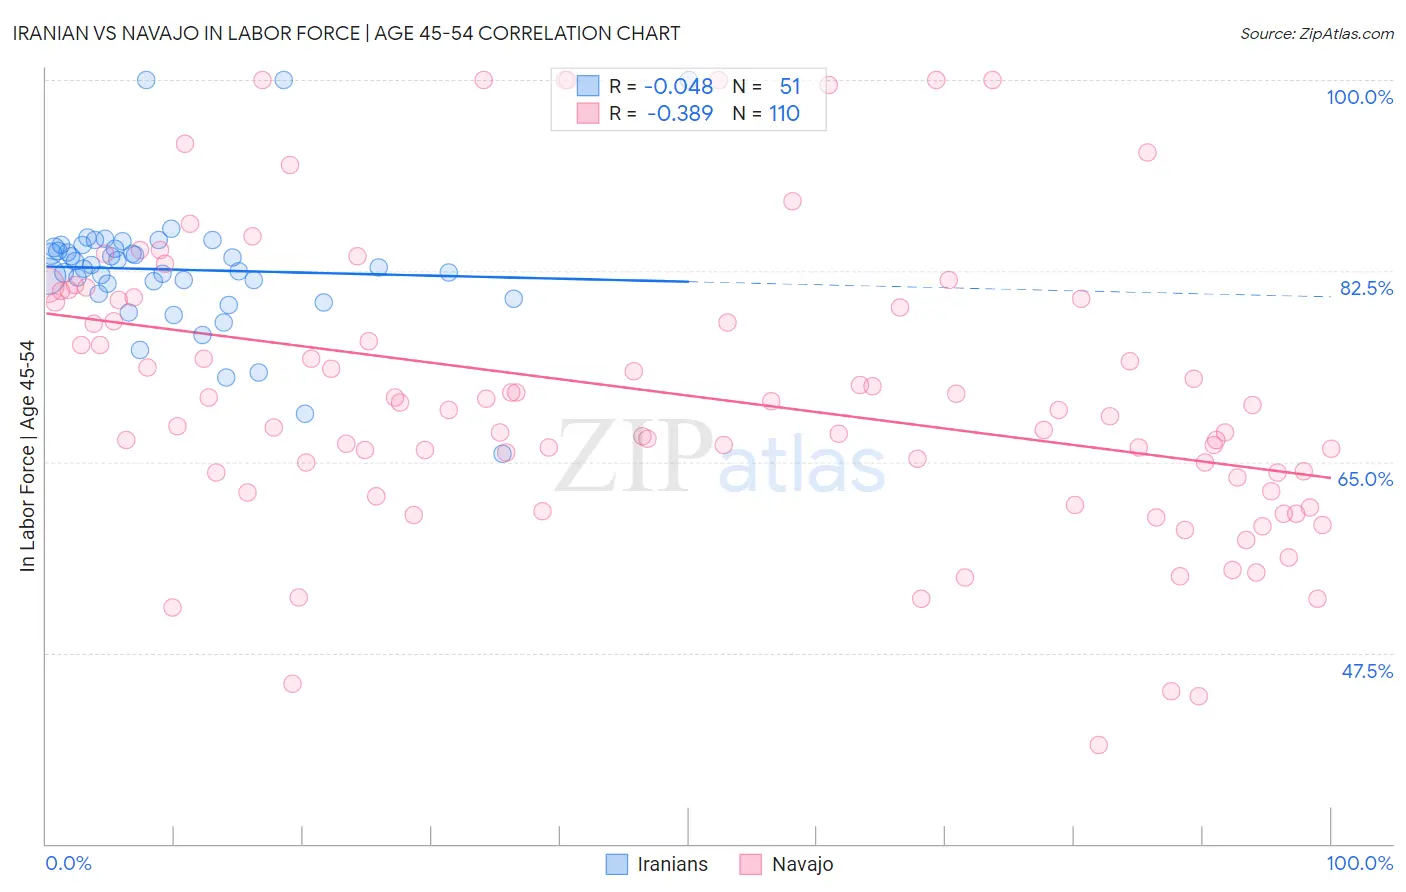
Iranian vs Navajo In Labor Force | Age 45-54 Correlation Chart
The statistical analysis conducted on geographies consisting of 316,652,476 people shows no correlation between the proportion of Iranians and labor force participation rate among population between the ages 45 and 54 in the United States with a correlation coefficient (R) of -0.048 and weighted average of 83.2%. Similarly, the statistical analysis conducted on geographies consisting of 224,749,345 people shows a mild negative correlation between the proportion of Navajo and labor force participation rate among population between the ages 45 and 54 in the United States with a correlation coefficient (R) of -0.389 and weighted average of 72.8%, a difference of 14.3%.
In Labor Force | Age 45-54 Correlation Summary
| Measurement | Iranian | Navajo |
| Minimum | 65.7% | 39.0% |
| Maximum | 100.0% | 100.0% |
| Range | 34.3% | 61.0% |
| Mean | 82.6% | 71.2% |
| Median | 82.8% | 69.7% |
| Interquartile 25% (IQ1) | 80.4% | 63.6% |
| Interquartile 75% (IQ3) | 84.6% | 79.9% |
| Interquartile Range (IQR) | 4.3% | 16.3% |
| Standard Deviation (Sample) | 6.1% | 13.3% |
| Standard Deviation (Population) | 6.0% | 13.2% |
Similar Demographics by In Labor Force | Age 45-54
Demographics Similar to Iranians by In Labor Force | Age 45-54
In terms of in labor force | age 45-54, the demographic groups most similar to Iranians are Slovak (83.2%, a difference of 0.0%), Sri Lankan (83.2%, a difference of 0.010%), Ukrainian (83.2%, a difference of 0.010%), Immigrants from Africa (83.2%, a difference of 0.010%), and Immigrants from Italy (83.2%, a difference of 0.010%).
| Demographics | Rating | Rank | In Labor Force | Age 45-54 |
| Mongolians | 94.2 /100 | #100 | Exceptional 83.3% |
| Immigrants | Belarus | 94.1 /100 | #101 | Exceptional 83.3% |
| Immigrants | Singapore | 93.9 /100 | #102 | Exceptional 83.3% |
| Albanians | 93.9 /100 | #103 | Exceptional 83.3% |
| Immigrants | Romania | 93.8 /100 | #104 | Exceptional 83.3% |
| Immigrants | South America | 93.5 /100 | #105 | Exceptional 83.2% |
| Sri Lankans | 93.2 /100 | #106 | Exceptional 83.2% |
| Iranians | 92.9 /100 | #107 | Exceptional 83.2% |
| Slovaks | 92.8 /100 | #108 | Exceptional 83.2% |
| Ukrainians | 92.7 /100 | #109 | Exceptional 83.2% |
| Immigrants | Africa | 92.6 /100 | #110 | Exceptional 83.2% |
| Immigrants | Italy | 92.5 /100 | #111 | Exceptional 83.2% |
| Immigrants | Afghanistan | 92.4 /100 | #112 | Exceptional 83.2% |
| Immigrants | Albania | 91.8 /100 | #113 | Exceptional 83.2% |
| Assyrians/Chaldeans/Syriacs | 91.7 /100 | #114 | Exceptional 83.2% |
Demographics Similar to Navajo by In Labor Force | Age 45-54
In terms of in labor force | age 45-54, the demographic groups most similar to Navajo are Pima (72.8%, a difference of 0.050%), Houma (74.1%, a difference of 1.8%), Immigrants from Yemen (74.4%, a difference of 2.2%), Hopi (75.0%, a difference of 3.0%), and Tohono O'odham (75.1%, a difference of 3.2%).
| Demographics | Rating | Rank | In Labor Force | Age 45-54 |
| Natives/Alaskans | 0.0 /100 | #333 | Tragic 77.1% |
| Apache | 0.0 /100 | #334 | Tragic 77.1% |
| Arapaho | 0.0 /100 | #335 | Tragic 77.1% |
| Paiute | 0.0 /100 | #336 | Tragic 76.7% |
| Ute | 0.0 /100 | #337 | Tragic 76.6% |
| Yuman | 0.0 /100 | #338 | Tragic 76.3% |
| Puerto Ricans | 0.0 /100 | #339 | Tragic 75.9% |
| Lumbee | 0.0 /100 | #340 | Tragic 75.6% |
| Pueblo | 0.0 /100 | #341 | Tragic 75.5% |
| Tohono O'odham | 0.0 /100 | #342 | Tragic 75.1% |
| Hopi | 0.0 /100 | #343 | Tragic 75.0% |
| Immigrants | Yemen | 0.0 /100 | #344 | Tragic 74.4% |
| Houma | 0.0 /100 | #345 | Tragic 74.1% |
| Pima | 0.0 /100 | #346 | Tragic 72.8% |
| Navajo | 0.0 /100 | #347 | Tragic 72.8% |