Immigrants from Jamaica vs Yakama In Labor Force | Age 45-54
COMPARE
Immigrants from Jamaica
Yakama
In Labor Force | Age 45-54
In Labor Force | Age 45-54 Comparison
Immigrants from Jamaica
Yakama
82.1%
IN LABOR FORCE | AGE 45-54
2.7/ 100
METRIC RATING
224th/ 347
METRIC RANK
80.6%
IN LABOR FORCE | AGE 45-54
0.0/ 100
METRIC RATING
294th/ 347
METRIC RANK
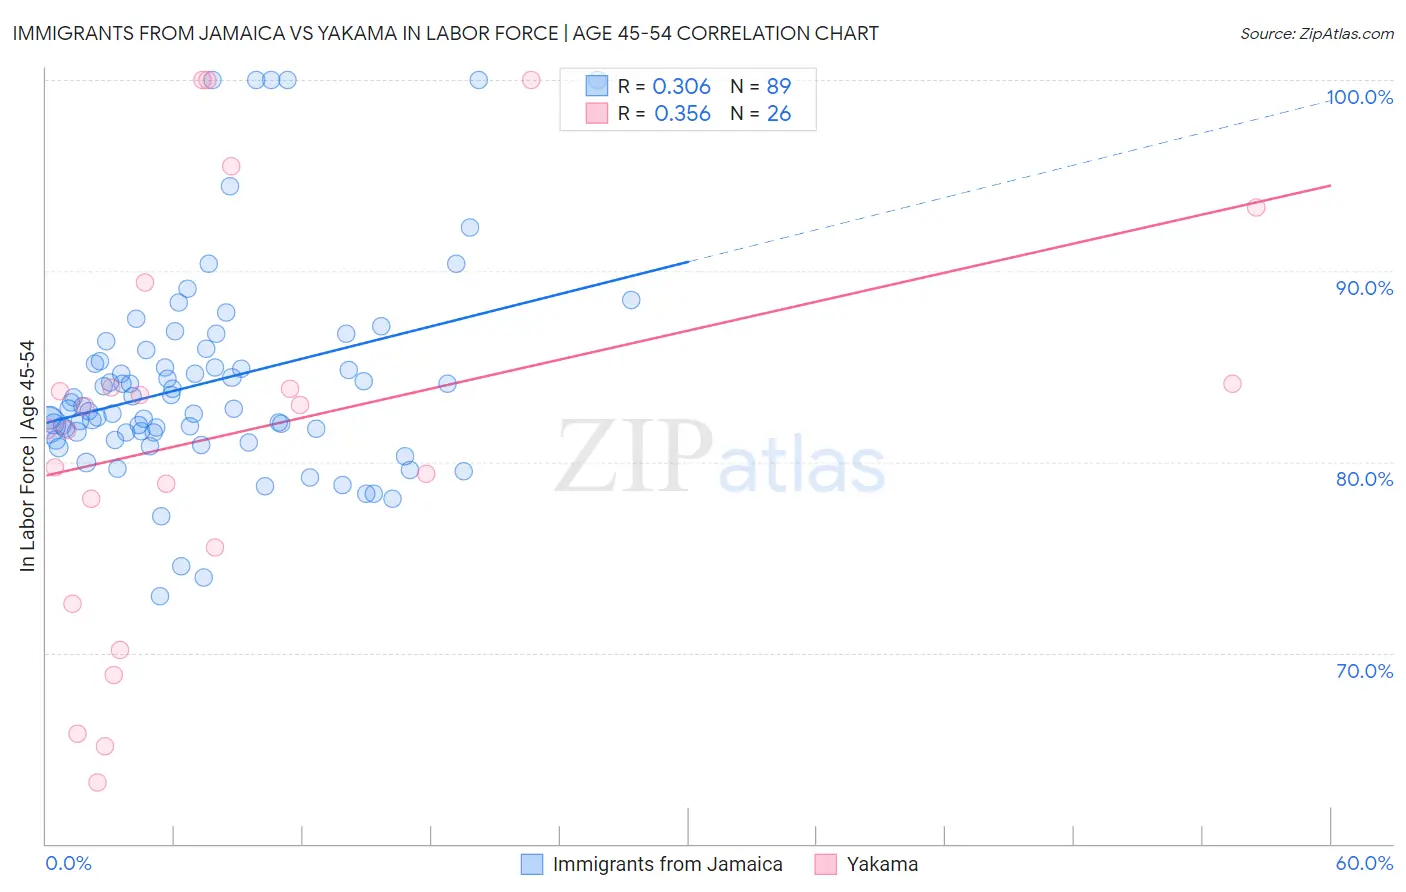
Immigrants from Jamaica vs Yakama In Labor Force | Age 45-54 Correlation Chart
The statistical analysis conducted on geographies consisting of 301,584,451 people shows a mild positive correlation between the proportion of Immigrants from Jamaica and labor force participation rate among population between the ages 45 and 54 in the United States with a correlation coefficient (R) of 0.306 and weighted average of 82.1%. Similarly, the statistical analysis conducted on geographies consisting of 19,917,759 people shows a mild positive correlation between the proportion of Yakama and labor force participation rate among population between the ages 45 and 54 in the United States with a correlation coefficient (R) of 0.356 and weighted average of 80.6%, a difference of 1.9%.
In Labor Force | Age 45-54 Correlation Summary
| Measurement | Immigrants from Jamaica | Yakama |
| Minimum | 73.0% | 63.2% |
| Maximum | 100.0% | 100.0% |
| Range | 27.0% | 36.8% |
| Mean | 84.2% | 81.7% |
| Median | 82.8% | 82.3% |
| Interquartile 25% (IQ1) | 81.5% | 75.5% |
| Interquartile 75% (IQ3) | 85.5% | 84.1% |
| Interquartile Range (IQR) | 4.0% | 8.6% |
| Standard Deviation (Sample) | 5.6% | 10.5% |
| Standard Deviation (Population) | 5.5% | 10.3% |
Similar Demographics by In Labor Force | Age 45-54
Demographics Similar to Immigrants from Jamaica by In Labor Force | Age 45-54
In terms of in labor force | age 45-54, the demographic groups most similar to Immigrants from Jamaica are Immigrants from Oceania (82.1%, a difference of 0.020%), Immigrants from Caribbean (82.1%, a difference of 0.020%), Immigrants (82.1%, a difference of 0.030%), Immigrants from Germany (82.1%, a difference of 0.030%), and Panamanian (82.2%, a difference of 0.060%).
| Demographics | Rating | Rank | In Labor Force | Age 45-54 |
| Portuguese | 4.7 /100 | #217 | Tragic 82.2% |
| English | 4.4 /100 | #218 | Tragic 82.2% |
| French | 4.1 /100 | #219 | Tragic 82.2% |
| Bahamians | 3.6 /100 | #220 | Tragic 82.2% |
| Panamanians | 3.5 /100 | #221 | Tragic 82.2% |
| Immigrants | Ecuador | 3.4 /100 | #222 | Tragic 82.2% |
| Immigrants | Immigrants | 3.1 /100 | #223 | Tragic 82.1% |
| Immigrants | Jamaica | 2.7 /100 | #224 | Tragic 82.1% |
| Immigrants | Oceania | 2.5 /100 | #225 | Tragic 82.1% |
| Immigrants | Caribbean | 2.5 /100 | #226 | Tragic 82.1% |
| Immigrants | Germany | 2.4 /100 | #227 | Tragic 82.1% |
| Cape Verdeans | 2.1 /100 | #228 | Tragic 82.1% |
| Immigrants | Burma/Myanmar | 1.9 /100 | #229 | Tragic 82.0% |
| Jamaicans | 1.8 /100 | #230 | Tragic 82.0% |
| Immigrants | Senegal | 1.7 /100 | #231 | Tragic 82.0% |
Demographics Similar to Yakama by In Labor Force | Age 45-54
In terms of in labor force | age 45-54, the demographic groups most similar to Yakama are Osage (80.6%, a difference of 0.0%), Iroquois (80.6%, a difference of 0.020%), Immigrants from Belize (80.6%, a difference of 0.050%), Nepalese (80.5%, a difference of 0.070%), and African (80.5%, a difference of 0.10%).
| Demographics | Rating | Rank | In Labor Force | Age 45-54 |
| Vietnamese | 0.0 /100 | #287 | Tragic 80.8% |
| Cree | 0.0 /100 | #288 | Tragic 80.8% |
| Immigrants | Bangladesh | 0.0 /100 | #289 | Tragic 80.7% |
| Mexican American Indians | 0.0 /100 | #290 | Tragic 80.7% |
| Immigrants | Belize | 0.0 /100 | #291 | Tragic 80.6% |
| Iroquois | 0.0 /100 | #292 | Tragic 80.6% |
| Osage | 0.0 /100 | #293 | Tragic 80.6% |
| Yakama | 0.0 /100 | #294 | Tragic 80.6% |
| Nepalese | 0.0 /100 | #295 | Tragic 80.5% |
| Africans | 0.0 /100 | #296 | Tragic 80.5% |
| Americans | 0.0 /100 | #297 | Tragic 80.4% |
| Marshallese | 0.0 /100 | #298 | Tragic 80.3% |
| Dominicans | 0.0 /100 | #299 | Tragic 80.3% |
| Fijians | 0.0 /100 | #300 | Tragic 80.2% |
| Spanish American Indians | 0.0 /100 | #301 | Tragic 80.2% |