Blackfeet vs Menominee In Labor Force | Age 30-34
COMPARE
Blackfeet
Menominee
In Labor Force | Age 30-34
In Labor Force | Age 30-34 Comparison
Blackfeet
Menominee
82.8%
IN LABOR FORCE | AGE 30-34
0.0/ 100
METRIC RATING
290th/ 347
METRIC RANK
82.2%
IN LABOR FORCE | AGE 30-34
0.0/ 100
METRIC RATING
307th/ 347
METRIC RANK
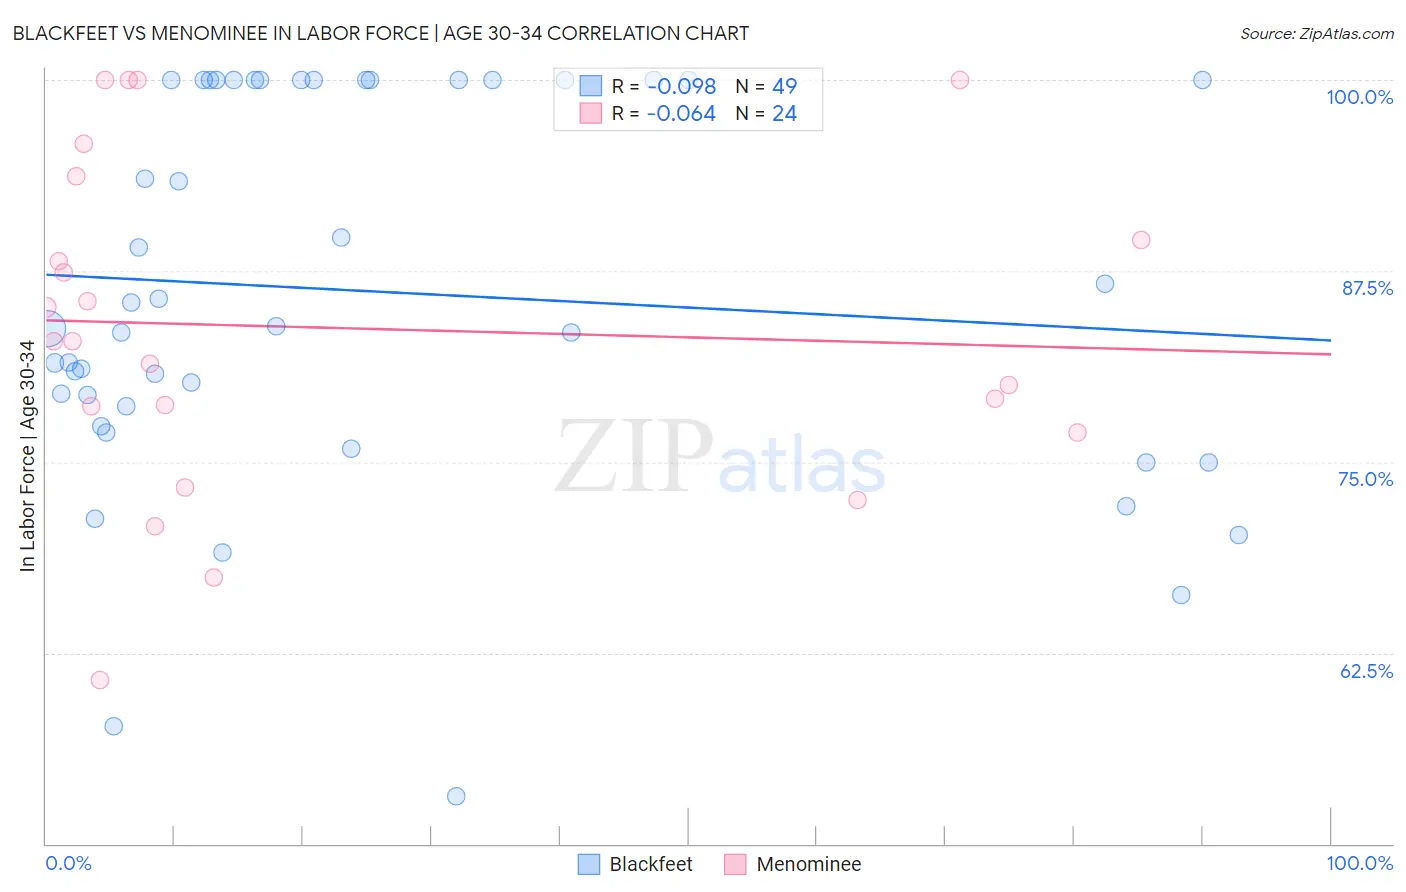
Blackfeet vs Menominee In Labor Force | Age 30-34 Correlation Chart
The statistical analysis conducted on geographies consisting of 309,450,197 people shows a slight negative correlation between the proportion of Blackfeet and labor force participation rate among population between the ages 30 and 34 in the United States with a correlation coefficient (R) of -0.098 and weighted average of 82.8%. Similarly, the statistical analysis conducted on geographies consisting of 45,774,457 people shows a slight negative correlation between the proportion of Menominee and labor force participation rate among population between the ages 30 and 34 in the United States with a correlation coefficient (R) of -0.064 and weighted average of 82.2%, a difference of 0.75%.
In Labor Force | Age 30-34 Correlation Summary
| Measurement | Blackfeet | Menominee |
| Minimum | 53.1% | 60.7% |
| Maximum | 100.0% | 100.0% |
| Range | 46.9% | 39.3% |
| Mean | 86.2% | 83.8% |
| Median | 83.9% | 82.9% |
| Interquartile 25% (IQ1) | 78.0% | 77.8% |
| Interquartile 75% (IQ3) | 100.0% | 91.6% |
| Interquartile Range (IQR) | 22.0% | 13.8% |
| Standard Deviation (Sample) | 12.5% | 10.9% |
| Standard Deviation (Population) | 12.4% | 10.6% |
Demographics Similar to Blackfeet and Menominee by In Labor Force | Age 30-34
In terms of in labor force | age 30-34, the demographic groups most similar to Blackfeet are Potawatomi (82.8%, a difference of 0.020%), Black/African American (82.8%, a difference of 0.040%), Nepalese (82.7%, a difference of 0.11%), American (82.7%, a difference of 0.13%), and Hawaiian (83.0%, a difference of 0.23%). Similarly, the demographic groups most similar to Menominee are Spanish American Indian (82.2%, a difference of 0.060%), Osage (82.3%, a difference of 0.070%), Puget Sound Salish (82.1%, a difference of 0.10%), Tlingit-Haida (82.3%, a difference of 0.15%), and Immigrants from Micronesia (82.4%, a difference of 0.23%).
| Demographics | Rating | Rank | In Labor Force | Age 30-34 |
| Central American Indians | 0.0 /100 | #288 | Tragic 83.0% |
| Hawaiians | 0.0 /100 | #289 | Tragic 83.0% |
| Blackfeet | 0.0 /100 | #290 | Tragic 82.8% |
| Potawatomi | 0.0 /100 | #291 | Tragic 82.8% |
| Blacks/African Americans | 0.0 /100 | #292 | Tragic 82.8% |
| Nepalese | 0.0 /100 | #293 | Tragic 82.7% |
| Americans | 0.0 /100 | #294 | Tragic 82.7% |
| Pennsylvania Germans | 0.0 /100 | #295 | Tragic 82.6% |
| Chippewa | 0.0 /100 | #296 | Tragic 82.6% |
| Comanche | 0.0 /100 | #297 | Tragic 82.6% |
| Aleuts | 0.0 /100 | #298 | Tragic 82.6% |
| Immigrants | Central America | 0.0 /100 | #299 | Tragic 82.5% |
| Hmong | 0.0 /100 | #300 | Tragic 82.4% |
| Hispanics or Latinos | 0.0 /100 | #301 | Tragic 82.4% |
| Ottawa | 0.0 /100 | #302 | Tragic 82.4% |
| Immigrants | Micronesia | 0.0 /100 | #303 | Tragic 82.4% |
| Tlingit-Haida | 0.0 /100 | #304 | Tragic 82.3% |
| Osage | 0.0 /100 | #305 | Tragic 82.3% |
| Spanish American Indians | 0.0 /100 | #306 | Tragic 82.2% |
| Menominee | 0.0 /100 | #307 | Tragic 82.2% |
| Puget Sound Salish | 0.0 /100 | #308 | Tragic 82.1% |