Icelander vs Menominee In Labor Force | Age 30-34
COMPARE
Icelander
Menominee
In Labor Force | Age 30-34
In Labor Force | Age 30-34 Comparison
Icelanders
Menominee
84.7%
IN LABOR FORCE | AGE 30-34
56.8/ 100
METRIC RATING
164th/ 347
METRIC RANK
82.2%
IN LABOR FORCE | AGE 30-34
0.0/ 100
METRIC RATING
307th/ 347
METRIC RANK
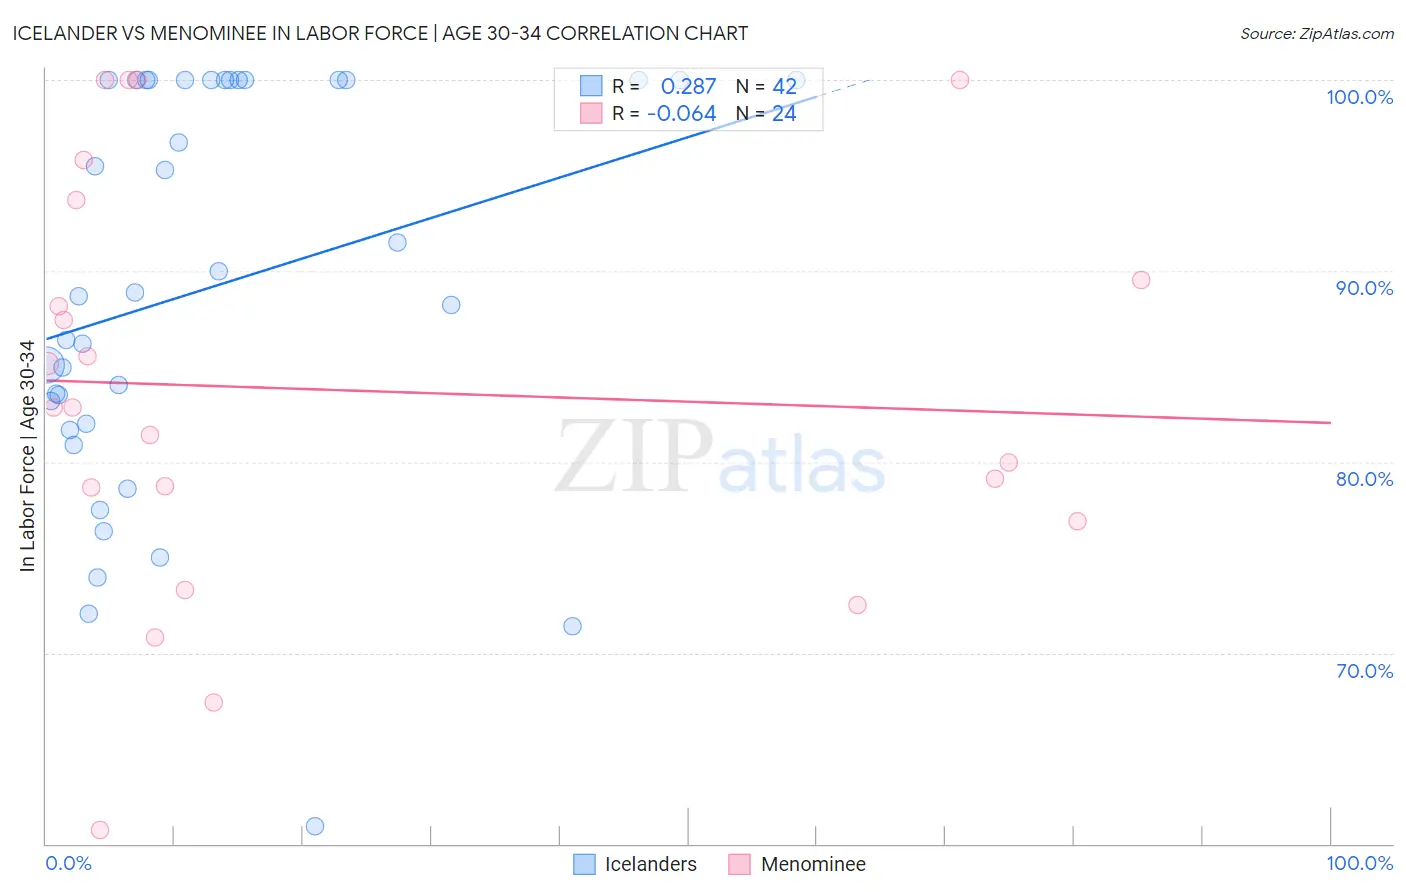
Icelander vs Menominee In Labor Force | Age 30-34 Correlation Chart
The statistical analysis conducted on geographies consisting of 159,636,707 people shows a weak positive correlation between the proportion of Icelanders and labor force participation rate among population between the ages 30 and 34 in the United States with a correlation coefficient (R) of 0.287 and weighted average of 84.7%. Similarly, the statistical analysis conducted on geographies consisting of 45,774,457 people shows a slight negative correlation between the proportion of Menominee and labor force participation rate among population between the ages 30 and 34 in the United States with a correlation coefficient (R) of -0.064 and weighted average of 82.2%, a difference of 3.1%.
In Labor Force | Age 30-34 Correlation Summary
| Measurement | Icelander | Menominee |
| Minimum | 60.9% | 60.7% |
| Maximum | 100.0% | 100.0% |
| Range | 39.1% | 39.3% |
| Mean | 89.1% | 83.8% |
| Median | 88.8% | 82.9% |
| Interquartile 25% (IQ1) | 82.0% | 77.8% |
| Interquartile 75% (IQ3) | 100.0% | 91.6% |
| Interquartile Range (IQR) | 18.0% | 13.8% |
| Standard Deviation (Sample) | 10.5% | 10.9% |
| Standard Deviation (Population) | 10.4% | 10.6% |
Similar Demographics by In Labor Force | Age 30-34
Demographics Similar to Icelanders by In Labor Force | Age 30-34
In terms of in labor force | age 30-34, the demographic groups most similar to Icelanders are Immigrants from Uruguay (84.7%, a difference of 0.0%), Immigrants from Western Europe (84.7%, a difference of 0.0%), South American (84.7%, a difference of 0.010%), Afghan (84.7%, a difference of 0.010%), and Immigrants from South Eastern Asia (84.7%, a difference of 0.020%).
| Demographics | Rating | Rank | In Labor Force | Age 30-34 |
| Peruvians | 65.9 /100 | #157 | Good 84.8% |
| Immigrants | Armenia | 64.7 /100 | #158 | Good 84.8% |
| Czechoslovakians | 63.0 /100 | #159 | Good 84.8% |
| Pakistanis | 60.8 /100 | #160 | Good 84.7% |
| Immigrants | Cambodia | 60.7 /100 | #161 | Good 84.7% |
| South Americans | 58.7 /100 | #162 | Average 84.7% |
| Immigrants | Uruguay | 57.4 /100 | #163 | Average 84.7% |
| Icelanders | 56.8 /100 | #164 | Average 84.7% |
| Immigrants | Western Europe | 56.7 /100 | #165 | Average 84.7% |
| Afghans | 55.2 /100 | #166 | Average 84.7% |
| Immigrants | South Eastern Asia | 54.2 /100 | #167 | Average 84.7% |
| Immigrants | Peru | 52.4 /100 | #168 | Average 84.7% |
| South American Indians | 52.1 /100 | #169 | Average 84.7% |
| Immigrants | Burma/Myanmar | 52.0 /100 | #170 | Average 84.7% |
| Irish | 52.0 /100 | #171 | Average 84.7% |
Demographics Similar to Menominee by In Labor Force | Age 30-34
In terms of in labor force | age 30-34, the demographic groups most similar to Menominee are Spanish American Indian (82.2%, a difference of 0.060%), Osage (82.3%, a difference of 0.070%), Puget Sound Salish (82.1%, a difference of 0.10%), Tlingit-Haida (82.3%, a difference of 0.15%), and Immigrants from Micronesia (82.4%, a difference of 0.23%).
| Demographics | Rating | Rank | In Labor Force | Age 30-34 |
| Hmong | 0.0 /100 | #300 | Tragic 82.4% |
| Hispanics or Latinos | 0.0 /100 | #301 | Tragic 82.4% |
| Ottawa | 0.0 /100 | #302 | Tragic 82.4% |
| Immigrants | Micronesia | 0.0 /100 | #303 | Tragic 82.4% |
| Tlingit-Haida | 0.0 /100 | #304 | Tragic 82.3% |
| Osage | 0.0 /100 | #305 | Tragic 82.3% |
| Spanish American Indians | 0.0 /100 | #306 | Tragic 82.2% |
| Menominee | 0.0 /100 | #307 | Tragic 82.2% |
| Puget Sound Salish | 0.0 /100 | #308 | Tragic 82.1% |
| Immigrants | Mexico | 0.0 /100 | #309 | Tragic 82.0% |
| Cajuns | 0.0 /100 | #310 | Tragic 82.0% |
| Chickasaw | 0.0 /100 | #311 | Tragic 81.9% |
| Mexicans | 0.0 /100 | #312 | Tragic 81.9% |
| Iroquois | 0.0 /100 | #313 | Tragic 81.9% |
| Alaskan Athabascans | 0.0 /100 | #314 | Tragic 81.7% |