Iranian vs Mexican American Indian In Labor Force | Age 30-34
COMPARE
Iranian
Mexican American Indian
In Labor Force | Age 30-34
In Labor Force | Age 30-34 Comparison
Iranians
Mexican American Indians
85.4%
IN LABOR FORCE | AGE 30-34
99.0/ 100
METRIC RATING
76th/ 347
METRIC RANK
83.2%
IN LABOR FORCE | AGE 30-34
0.0/ 100
METRIC RATING
282nd/ 347
METRIC RANK
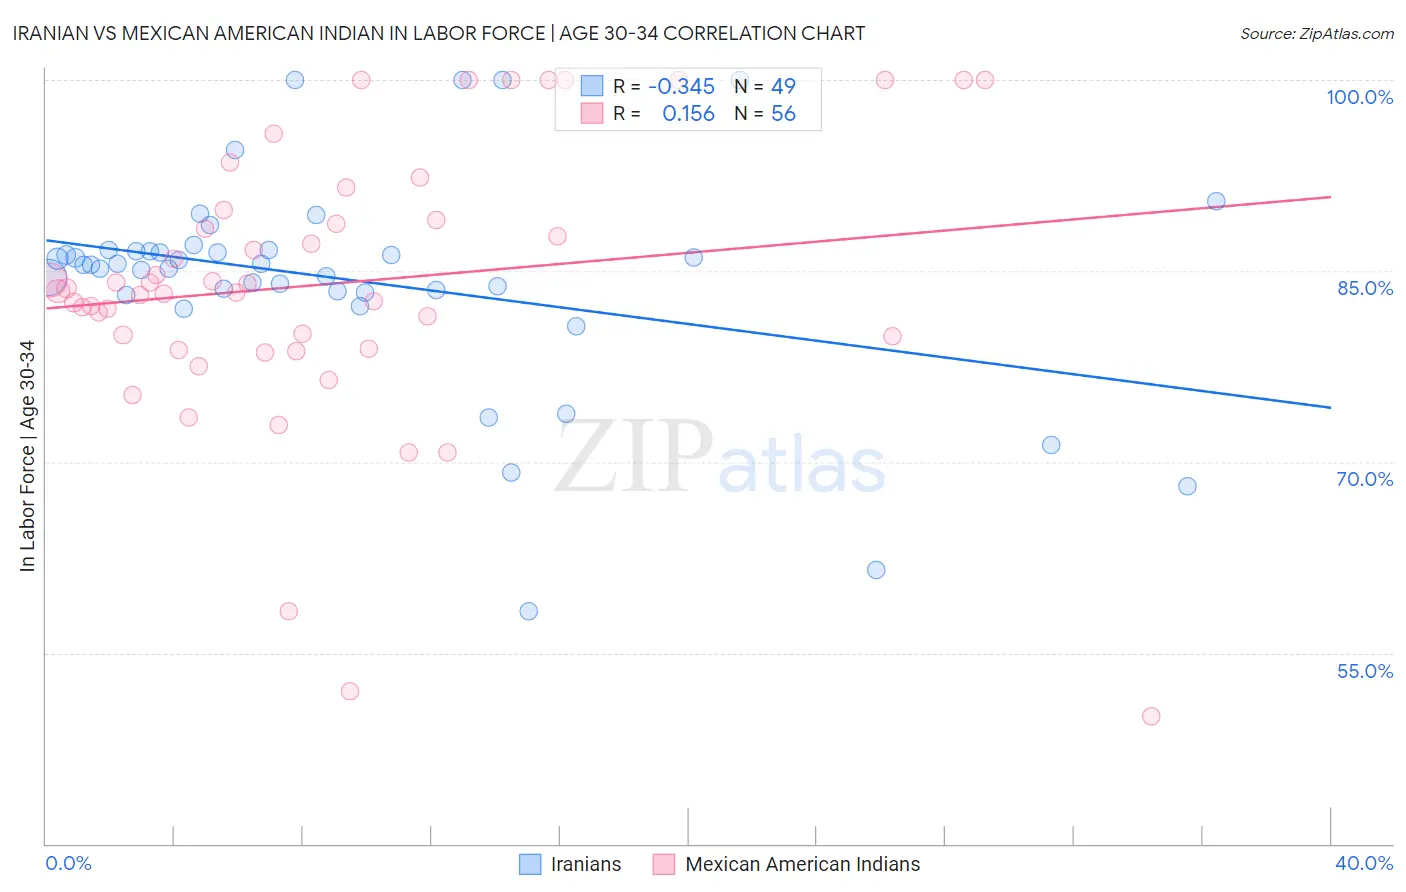
Iranian vs Mexican American Indian In Labor Force | Age 30-34 Correlation Chart
The statistical analysis conducted on geographies consisting of 316,667,155 people shows a mild negative correlation between the proportion of Iranians and labor force participation rate among population between the ages 30 and 34 in the United States with a correlation coefficient (R) of -0.345 and weighted average of 85.4%. Similarly, the statistical analysis conducted on geographies consisting of 317,534,502 people shows a poor positive correlation between the proportion of Mexican American Indians and labor force participation rate among population between the ages 30 and 34 in the United States with a correlation coefficient (R) of 0.156 and weighted average of 83.2%, a difference of 2.6%.
In Labor Force | Age 30-34 Correlation Summary
| Measurement | Iranian | Mexican American Indian |
| Minimum | 58.3% | 50.0% |
| Maximum | 100.0% | 100.0% |
| Range | 41.7% | 50.0% |
| Mean | 84.3% | 84.0% |
| Median | 85.5% | 83.5% |
| Interquartile 25% (IQ1) | 83.4% | 79.4% |
| Interquartile 75% (IQ3) | 86.6% | 89.4% |
| Interquartile Range (IQR) | 3.3% | 10.0% |
| Standard Deviation (Sample) | 8.4% | 10.9% |
| Standard Deviation (Population) | 8.3% | 10.8% |
Similar Demographics by In Labor Force | Age 30-34
Demographics Similar to Iranians by In Labor Force | Age 30-34
In terms of in labor force | age 30-34, the demographic groups most similar to Iranians are Immigrants from Czechoslovakia (85.4%, a difference of 0.0%), Immigrants from Japan (85.4%, a difference of 0.010%), Immigrants from China (85.4%, a difference of 0.010%), Indian (Asian) (85.4%, a difference of 0.010%), and Maltese (85.4%, a difference of 0.010%).
| Demographics | Rating | Rank | In Labor Force | Age 30-34 |
| Immigrants | Iran | 99.2 /100 | #69 | Exceptional 85.4% |
| Brazilians | 99.1 /100 | #70 | Exceptional 85.4% |
| Immigrants | Japan | 99.1 /100 | #71 | Exceptional 85.4% |
| Immigrants | China | 99.0 /100 | #72 | Exceptional 85.4% |
| Indians (Asian) | 99.0 /100 | #73 | Exceptional 85.4% |
| Maltese | 99.0 /100 | #74 | Exceptional 85.4% |
| Immigrants | Czechoslovakia | 99.0 /100 | #75 | Exceptional 85.4% |
| Iranians | 99.0 /100 | #76 | Exceptional 85.4% |
| Immigrants | Eastern Asia | 98.9 /100 | #77 | Exceptional 85.4% |
| Immigrants | Singapore | 98.8 /100 | #78 | Exceptional 85.3% |
| Immigrants | Switzerland | 98.7 /100 | #79 | Exceptional 85.3% |
| Immigrants | Russia | 98.7 /100 | #80 | Exceptional 85.3% |
| Slovaks | 98.7 /100 | #81 | Exceptional 85.3% |
| Immigrants | Africa | 98.6 /100 | #82 | Exceptional 85.3% |
| Immigrants | Europe | 98.6 /100 | #83 | Exceptional 85.3% |
Demographics Similar to Mexican American Indians by In Labor Force | Age 30-34
In terms of in labor force | age 30-34, the demographic groups most similar to Mexican American Indians are Assyrian/Chaldean/Syriac (83.2%, a difference of 0.010%), Samoan (83.3%, a difference of 0.040%), Immigrants from Belize (83.2%, a difference of 0.070%), Cree (83.2%, a difference of 0.070%), and Immigrants from Latin America (83.1%, a difference of 0.12%).
| Demographics | Rating | Rank | In Labor Force | Age 30-34 |
| Immigrants | Grenada | 0.0 /100 | #275 | Tragic 83.5% |
| Tongans | 0.0 /100 | #276 | Tragic 83.5% |
| Delaware | 0.0 /100 | #277 | Tragic 83.5% |
| Fijians | 0.0 /100 | #278 | Tragic 83.4% |
| Immigrants | Fiji | 0.0 /100 | #279 | Tragic 83.4% |
| Africans | 0.0 /100 | #280 | Tragic 83.4% |
| Samoans | 0.0 /100 | #281 | Tragic 83.3% |
| Mexican American Indians | 0.0 /100 | #282 | Tragic 83.2% |
| Assyrians/Chaldeans/Syriacs | 0.0 /100 | #283 | Tragic 83.2% |
| Immigrants | Belize | 0.0 /100 | #284 | Tragic 83.2% |
| Cree | 0.0 /100 | #285 | Tragic 83.2% |
| Immigrants | Latin America | 0.0 /100 | #286 | Tragic 83.1% |
| Native Hawaiians | 0.0 /100 | #287 | Tragic 83.0% |
| Central American Indians | 0.0 /100 | #288 | Tragic 83.0% |
| Hawaiians | 0.0 /100 | #289 | Tragic 83.0% |