Iranian vs Creek In Labor Force | Age 20-24
COMPARE
Iranian
Creek
In Labor Force | Age 20-24
In Labor Force | Age 20-24 Comparison
Iranians
Creek
72.6%
IN LABOR FORCE | AGE 20-24
0.0/ 100
METRIC RATING
299th/ 347
METRIC RANK
74.5%
IN LABOR FORCE | AGE 20-24
13.3/ 100
METRIC RATING
212th/ 347
METRIC RANK
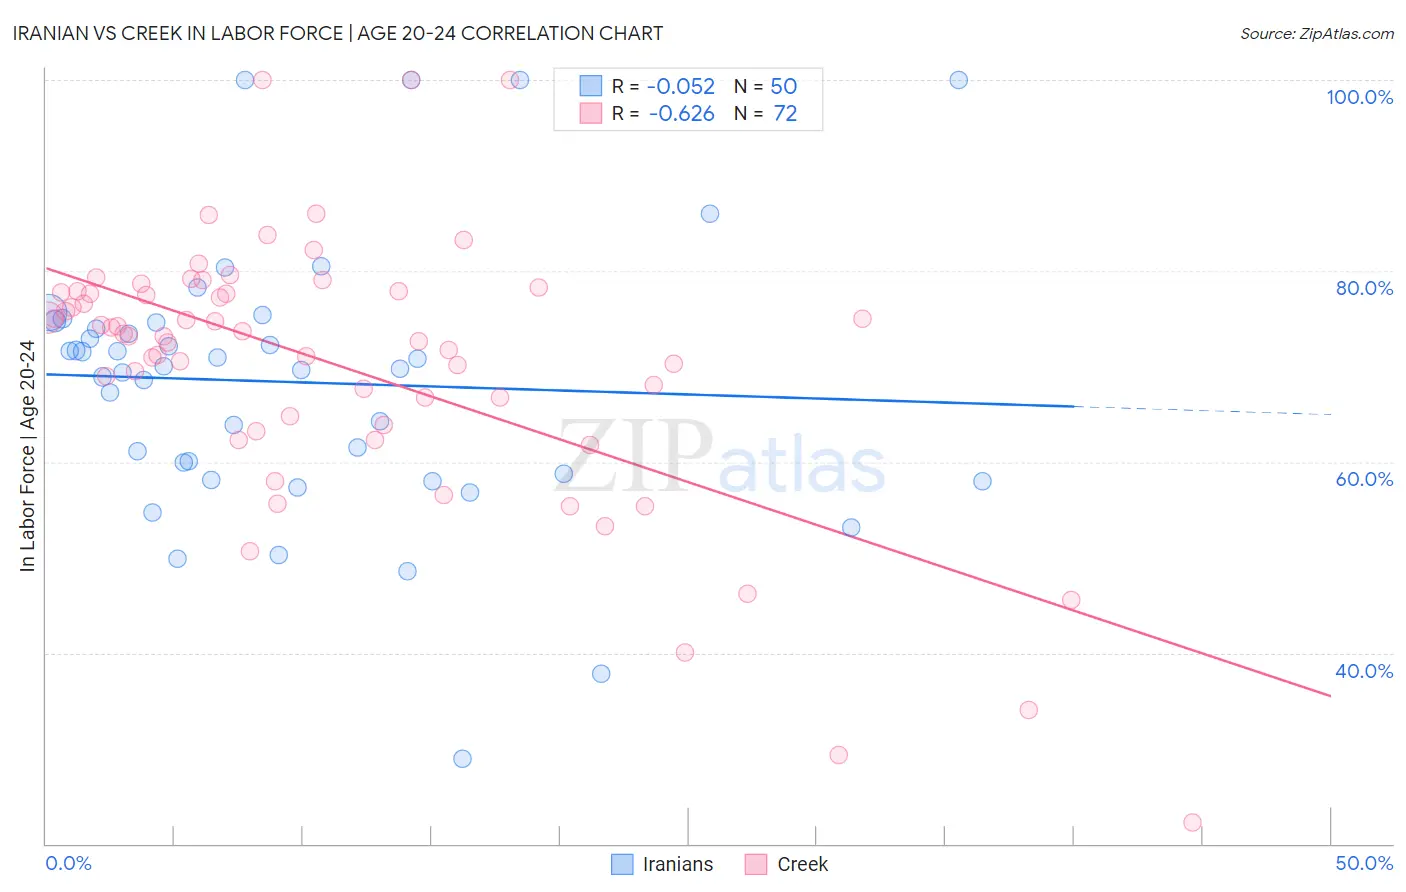
Iranian vs Creek In Labor Force | Age 20-24 Correlation Chart
The statistical analysis conducted on geographies consisting of 316,816,770 people shows a slight negative correlation between the proportion of Iranians and labor force participation rate among population between the ages 20 and 24 in the United States with a correlation coefficient (R) of -0.052 and weighted average of 72.6%. Similarly, the statistical analysis conducted on geographies consisting of 178,431,109 people shows a significant negative correlation between the proportion of Creek and labor force participation rate among population between the ages 20 and 24 in the United States with a correlation coefficient (R) of -0.626 and weighted average of 74.5%, a difference of 2.7%.
In Labor Force | Age 20-24 Correlation Summary
| Measurement | Iranian | Creek |
| Minimum | 28.9% | 22.2% |
| Maximum | 100.0% | 100.0% |
| Range | 71.1% | 77.8% |
| Mean | 68.4% | 70.1% |
| Median | 69.9% | 73.3% |
| Interquartile 25% (IQ1) | 58.8% | 64.3% |
| Interquartile 75% (IQ3) | 74.6% | 77.8% |
| Interquartile Range (IQR) | 15.8% | 13.5% |
| Standard Deviation (Sample) | 14.3% | 14.3% |
| Standard Deviation (Population) | 14.2% | 14.2% |
Similar Demographics by In Labor Force | Age 20-24
Demographics Similar to Iranians by In Labor Force | Age 20-24
In terms of in labor force | age 20-24, the demographic groups most similar to Iranians are Armenian (72.5%, a difference of 0.020%), Israeli (72.6%, a difference of 0.040%), Cuban (72.5%, a difference of 0.090%), Central American Indian (72.7%, a difference of 0.17%), and Native/Alaskan (72.4%, a difference of 0.18%).
| Demographics | Rating | Rank | In Labor Force | Age 20-24 |
| Pueblo | 0.0 /100 | #292 | Tragic 72.9% |
| Immigrants | Belize | 0.0 /100 | #293 | Tragic 72.8% |
| Immigrants | Argentina | 0.0 /100 | #294 | Tragic 72.8% |
| Okinawans | 0.0 /100 | #295 | Tragic 72.7% |
| Jamaicans | 0.0 /100 | #296 | Tragic 72.7% |
| Central American Indians | 0.0 /100 | #297 | Tragic 72.7% |
| Israelis | 0.0 /100 | #298 | Tragic 72.6% |
| Iranians | 0.0 /100 | #299 | Tragic 72.6% |
| Armenians | 0.0 /100 | #300 | Tragic 72.5% |
| Cubans | 0.0 /100 | #301 | Tragic 72.5% |
| Natives/Alaskans | 0.0 /100 | #302 | Tragic 72.4% |
| Ecuadorians | 0.0 /100 | #303 | Tragic 72.4% |
| Immigrants | West Indies | 0.0 /100 | #304 | Tragic 72.4% |
| Immigrants | Singapore | 0.0 /100 | #305 | Tragic 72.4% |
| Immigrants | Jamaica | 0.0 /100 | #306 | Tragic 72.4% |
Demographics Similar to Creek by In Labor Force | Age 20-24
In terms of in labor force | age 20-24, the demographic groups most similar to Creek are Peruvian (74.5%, a difference of 0.0%), Immigrants from Southern Europe (74.5%, a difference of 0.0%), Immigrants from Ghana (74.5%, a difference of 0.020%), Immigrants from Kuwait (74.5%, a difference of 0.020%), and Chilean (74.5%, a difference of 0.030%).
| Demographics | Rating | Rank | In Labor Force | Age 20-24 |
| Inupiat | 17.6 /100 | #205 | Poor 74.6% |
| Sioux | 17.5 /100 | #206 | Poor 74.6% |
| Albanians | 16.2 /100 | #207 | Poor 74.6% |
| Immigrants | Uruguay | 15.8 /100 | #208 | Poor 74.6% |
| Arabs | 15.8 /100 | #209 | Poor 74.6% |
| Uruguayans | 15.1 /100 | #210 | Poor 74.6% |
| Immigrants | Australia | 14.7 /100 | #211 | Poor 74.6% |
| Creek | 13.3 /100 | #212 | Poor 74.5% |
| Peruvians | 13.3 /100 | #213 | Poor 74.5% |
| Immigrants | Southern Europe | 13.2 /100 | #214 | Poor 74.5% |
| Immigrants | Ghana | 12.7 /100 | #215 | Poor 74.5% |
| Immigrants | Kuwait | 12.7 /100 | #216 | Poor 74.5% |
| Chileans | 12.5 /100 | #217 | Poor 74.5% |
| Immigrants | Peru | 10.6 /100 | #218 | Poor 74.5% |
| Nepalese | 10.5 /100 | #219 | Poor 74.5% |