Immigrants from Korea vs Creek In Labor Force | Age 20-24
COMPARE
Immigrants from Korea
Creek
In Labor Force | Age 20-24
In Labor Force | Age 20-24 Comparison
Immigrants from Korea
Creek
73.1%
IN LABOR FORCE | AGE 20-24
0.1/ 100
METRIC RATING
287th/ 347
METRIC RANK
74.5%
IN LABOR FORCE | AGE 20-24
13.3/ 100
METRIC RATING
212th/ 347
METRIC RANK
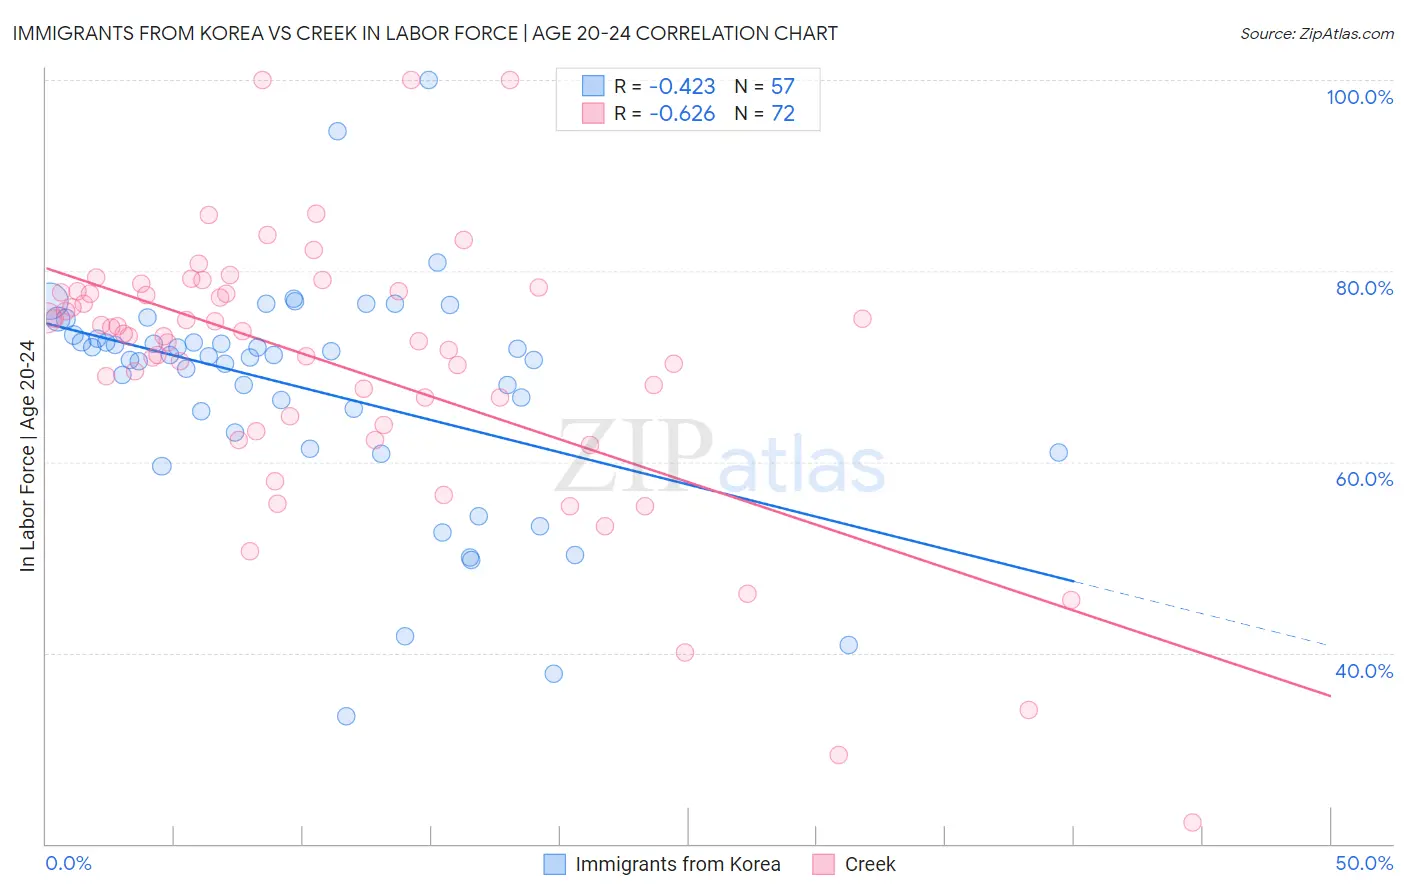
Immigrants from Korea vs Creek In Labor Force | Age 20-24 Correlation Chart
The statistical analysis conducted on geographies consisting of 416,204,507 people shows a moderate negative correlation between the proportion of Immigrants from Korea and labor force participation rate among population between the ages 20 and 24 in the United States with a correlation coefficient (R) of -0.423 and weighted average of 73.1%. Similarly, the statistical analysis conducted on geographies consisting of 178,431,109 people shows a significant negative correlation between the proportion of Creek and labor force participation rate among population between the ages 20 and 24 in the United States with a correlation coefficient (R) of -0.626 and weighted average of 74.5%, a difference of 1.9%.
In Labor Force | Age 20-24 Correlation Summary
| Measurement | Immigrants from Korea | Creek |
| Minimum | 33.3% | 22.2% |
| Maximum | 100.0% | 100.0% |
| Range | 66.7% | 77.8% |
| Mean | 67.6% | 70.1% |
| Median | 71.1% | 73.3% |
| Interquartile 25% (IQ1) | 62.2% | 64.3% |
| Interquartile 75% (IQ3) | 73.1% | 77.8% |
| Interquartile Range (IQR) | 10.8% | 13.5% |
| Standard Deviation (Sample) | 12.2% | 14.3% |
| Standard Deviation (Population) | 12.1% | 14.2% |
Similar Demographics by In Labor Force | Age 20-24
Demographics Similar to Immigrants from Korea by In Labor Force | Age 20-24
In terms of in labor force | age 20-24, the demographic groups most similar to Immigrants from Korea are Immigrants from Lebanon (73.1%, a difference of 0.020%), Nicaraguan (73.2%, a difference of 0.050%), Argentinean (73.1%, a difference of 0.080%), Kiowa (73.2%, a difference of 0.11%), and U.S. Virgin Islander (73.0%, a difference of 0.11%).
| Demographics | Rating | Rank | In Labor Force | Age 20-24 |
| Bahamians | 0.1 /100 | #280 | Tragic 73.3% |
| Immigrants | Venezuela | 0.1 /100 | #281 | Tragic 73.2% |
| Immigrants | Spain | 0.1 /100 | #282 | Tragic 73.2% |
| Immigrants | Bahamas | 0.1 /100 | #283 | Tragic 73.2% |
| Kiowa | 0.1 /100 | #284 | Tragic 73.2% |
| Nicaraguans | 0.1 /100 | #285 | Tragic 73.2% |
| Immigrants | Lebanon | 0.1 /100 | #286 | Tragic 73.1% |
| Immigrants | Korea | 0.1 /100 | #287 | Tragic 73.1% |
| Argentineans | 0.1 /100 | #288 | Tragic 73.1% |
| U.S. Virgin Islanders | 0.1 /100 | #289 | Tragic 73.0% |
| Immigrants | Belarus | 0.1 /100 | #290 | Tragic 73.0% |
| Immigrants | Nicaragua | 0.0 /100 | #291 | Tragic 72.9% |
| Pueblo | 0.0 /100 | #292 | Tragic 72.9% |
| Immigrants | Belize | 0.0 /100 | #293 | Tragic 72.8% |
| Immigrants | Argentina | 0.0 /100 | #294 | Tragic 72.8% |
Demographics Similar to Creek by In Labor Force | Age 20-24
In terms of in labor force | age 20-24, the demographic groups most similar to Creek are Peruvian (74.5%, a difference of 0.0%), Immigrants from Southern Europe (74.5%, a difference of 0.0%), Immigrants from Ghana (74.5%, a difference of 0.020%), Immigrants from Kuwait (74.5%, a difference of 0.020%), and Chilean (74.5%, a difference of 0.030%).
| Demographics | Rating | Rank | In Labor Force | Age 20-24 |
| Inupiat | 17.6 /100 | #205 | Poor 74.6% |
| Sioux | 17.5 /100 | #206 | Poor 74.6% |
| Albanians | 16.2 /100 | #207 | Poor 74.6% |
| Immigrants | Uruguay | 15.8 /100 | #208 | Poor 74.6% |
| Arabs | 15.8 /100 | #209 | Poor 74.6% |
| Uruguayans | 15.1 /100 | #210 | Poor 74.6% |
| Immigrants | Australia | 14.7 /100 | #211 | Poor 74.6% |
| Creek | 13.3 /100 | #212 | Poor 74.5% |
| Peruvians | 13.3 /100 | #213 | Poor 74.5% |
| Immigrants | Southern Europe | 13.2 /100 | #214 | Poor 74.5% |
| Immigrants | Ghana | 12.7 /100 | #215 | Poor 74.5% |
| Immigrants | Kuwait | 12.7 /100 | #216 | Poor 74.5% |
| Chileans | 12.5 /100 | #217 | Poor 74.5% |
| Immigrants | Peru | 10.6 /100 | #218 | Poor 74.5% |
| Nepalese | 10.5 /100 | #219 | Poor 74.5% |