Czechoslovakian vs Creek In Labor Force | Age 20-24
COMPARE
Czechoslovakian
Creek
In Labor Force | Age 20-24
In Labor Force | Age 20-24 Comparison
Czechoslovakians
Creek
77.5%
IN LABOR FORCE | AGE 20-24
100.0/ 100
METRIC RATING
37th/ 347
METRIC RANK
74.5%
IN LABOR FORCE | AGE 20-24
13.3/ 100
METRIC RATING
212th/ 347
METRIC RANK
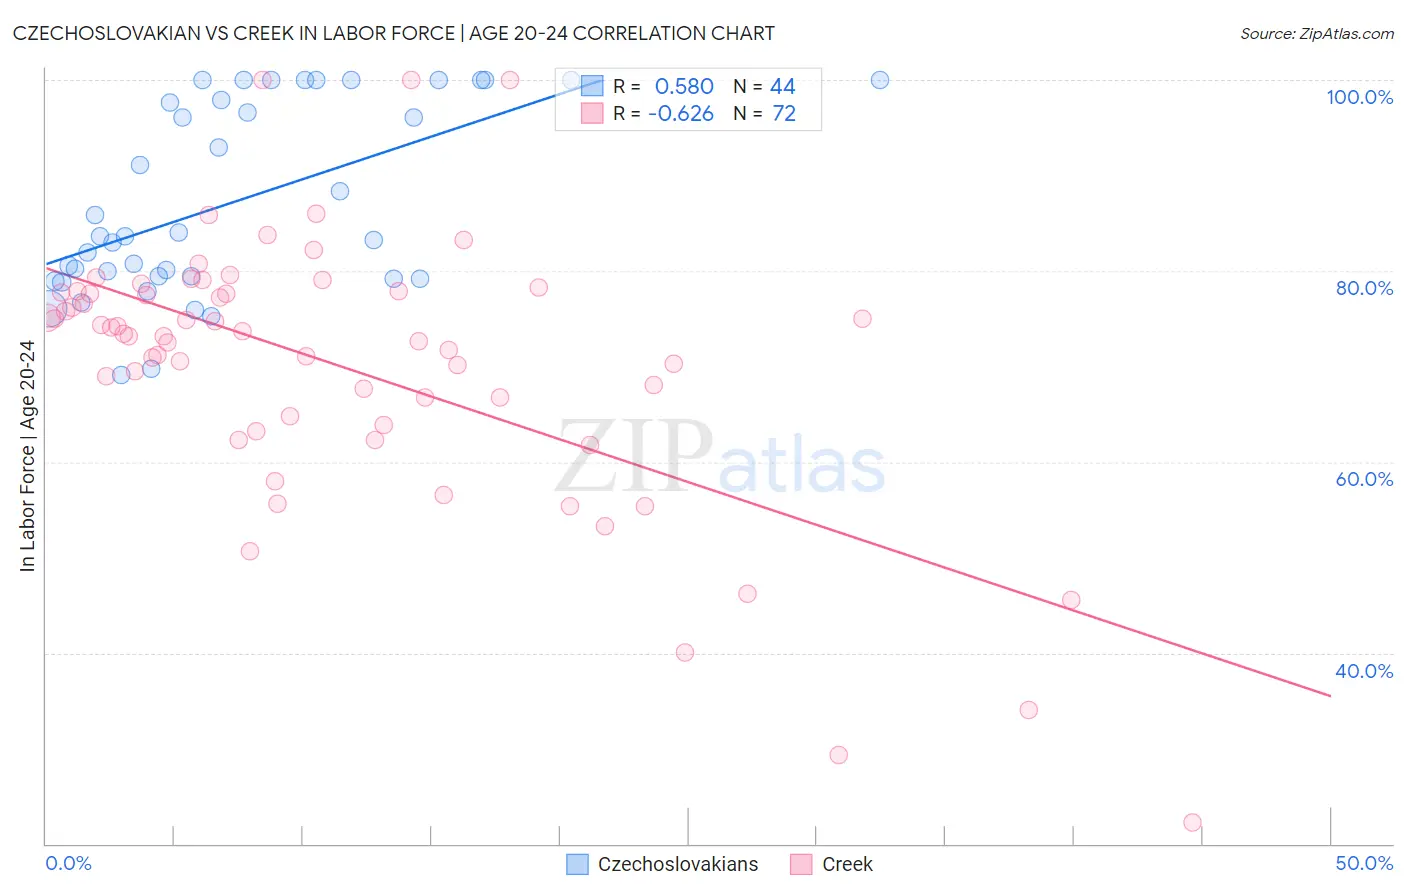
Czechoslovakian vs Creek In Labor Force | Age 20-24 Correlation Chart
The statistical analysis conducted on geographies consisting of 368,456,414 people shows a substantial positive correlation between the proportion of Czechoslovakians and labor force participation rate among population between the ages 20 and 24 in the United States with a correlation coefficient (R) of 0.580 and weighted average of 77.5%. Similarly, the statistical analysis conducted on geographies consisting of 178,431,109 people shows a significant negative correlation between the proportion of Creek and labor force participation rate among population between the ages 20 and 24 in the United States with a correlation coefficient (R) of -0.626 and weighted average of 74.5%, a difference of 4.0%.
In Labor Force | Age 20-24 Correlation Summary
| Measurement | Czechoslovakian | Creek |
| Minimum | 69.1% | 22.2% |
| Maximum | 100.0% | 100.0% |
| Range | 30.9% | 77.8% |
| Mean | 87.3% | 70.1% |
| Median | 83.6% | 73.3% |
| Interquartile 25% (IQ1) | 79.3% | 64.3% |
| Interquartile 75% (IQ3) | 98.9% | 77.8% |
| Interquartile Range (IQR) | 19.6% | 13.5% |
| Standard Deviation (Sample) | 10.0% | 14.3% |
| Standard Deviation (Population) | 9.8% | 14.2% |
Similar Demographics by In Labor Force | Age 20-24
Demographics Similar to Czechoslovakians by In Labor Force | Age 20-24
In terms of in labor force | age 20-24, the demographic groups most similar to Czechoslovakians are Welsh (77.5%, a difference of 0.010%), Immigrants from Eastern Africa (77.5%, a difference of 0.030%), Immigrants from Ethiopia (77.5%, a difference of 0.050%), German Russian (77.5%, a difference of 0.050%), and Marshallese (77.4%, a difference of 0.050%).
| Demographics | Rating | Rank | In Labor Force | Age 20-24 |
| Swiss | 100.0 /100 | #30 | Exceptional 77.7% |
| Poles | 100.0 /100 | #31 | Exceptional 77.6% |
| English | 100.0 /100 | #32 | Exceptional 77.6% |
| Immigrants | Ethiopia | 100.0 /100 | #33 | Exceptional 77.5% |
| German Russians | 100.0 /100 | #34 | Exceptional 77.5% |
| Immigrants | Eastern Africa | 100.0 /100 | #35 | Exceptional 77.5% |
| Welsh | 100.0 /100 | #36 | Exceptional 77.5% |
| Czechoslovakians | 100.0 /100 | #37 | Exceptional 77.5% |
| Marshallese | 100.0 /100 | #38 | Exceptional 77.4% |
| Irish | 100.0 /100 | #39 | Exceptional 77.4% |
| Scottish | 100.0 /100 | #40 | Exceptional 77.4% |
| Immigrants | Congo | 100.0 /100 | #41 | Exceptional 77.4% |
| French | 100.0 /100 | #42 | Exceptional 77.4% |
| Immigrants | Laos | 100.0 /100 | #43 | Exceptional 77.4% |
| Fijians | 100.0 /100 | #44 | Exceptional 77.4% |
Demographics Similar to Creek by In Labor Force | Age 20-24
In terms of in labor force | age 20-24, the demographic groups most similar to Creek are Peruvian (74.5%, a difference of 0.0%), Immigrants from Southern Europe (74.5%, a difference of 0.0%), Immigrants from Ghana (74.5%, a difference of 0.020%), Immigrants from Kuwait (74.5%, a difference of 0.020%), and Chilean (74.5%, a difference of 0.030%).
| Demographics | Rating | Rank | In Labor Force | Age 20-24 |
| Inupiat | 17.6 /100 | #205 | Poor 74.6% |
| Sioux | 17.5 /100 | #206 | Poor 74.6% |
| Albanians | 16.2 /100 | #207 | Poor 74.6% |
| Immigrants | Uruguay | 15.8 /100 | #208 | Poor 74.6% |
| Arabs | 15.8 /100 | #209 | Poor 74.6% |
| Uruguayans | 15.1 /100 | #210 | Poor 74.6% |
| Immigrants | Australia | 14.7 /100 | #211 | Poor 74.6% |
| Creek | 13.3 /100 | #212 | Poor 74.5% |
| Peruvians | 13.3 /100 | #213 | Poor 74.5% |
| Immigrants | Southern Europe | 13.2 /100 | #214 | Poor 74.5% |
| Immigrants | Ghana | 12.7 /100 | #215 | Poor 74.5% |
| Immigrants | Kuwait | 12.7 /100 | #216 | Poor 74.5% |
| Chileans | 12.5 /100 | #217 | Poor 74.5% |
| Immigrants | Peru | 10.6 /100 | #218 | Poor 74.5% |
| Nepalese | 10.5 /100 | #219 | Poor 74.5% |