Immigrants from Cameroon vs Creek In Labor Force | Age 20-24
COMPARE
Immigrants from Cameroon
Creek
In Labor Force | Age 20-24
In Labor Force | Age 20-24 Comparison
Immigrants from Cameroon
Creek
76.6%
IN LABOR FORCE | AGE 20-24
99.6/ 100
METRIC RATING
77th/ 347
METRIC RANK
74.5%
IN LABOR FORCE | AGE 20-24
13.3/ 100
METRIC RATING
212th/ 347
METRIC RANK
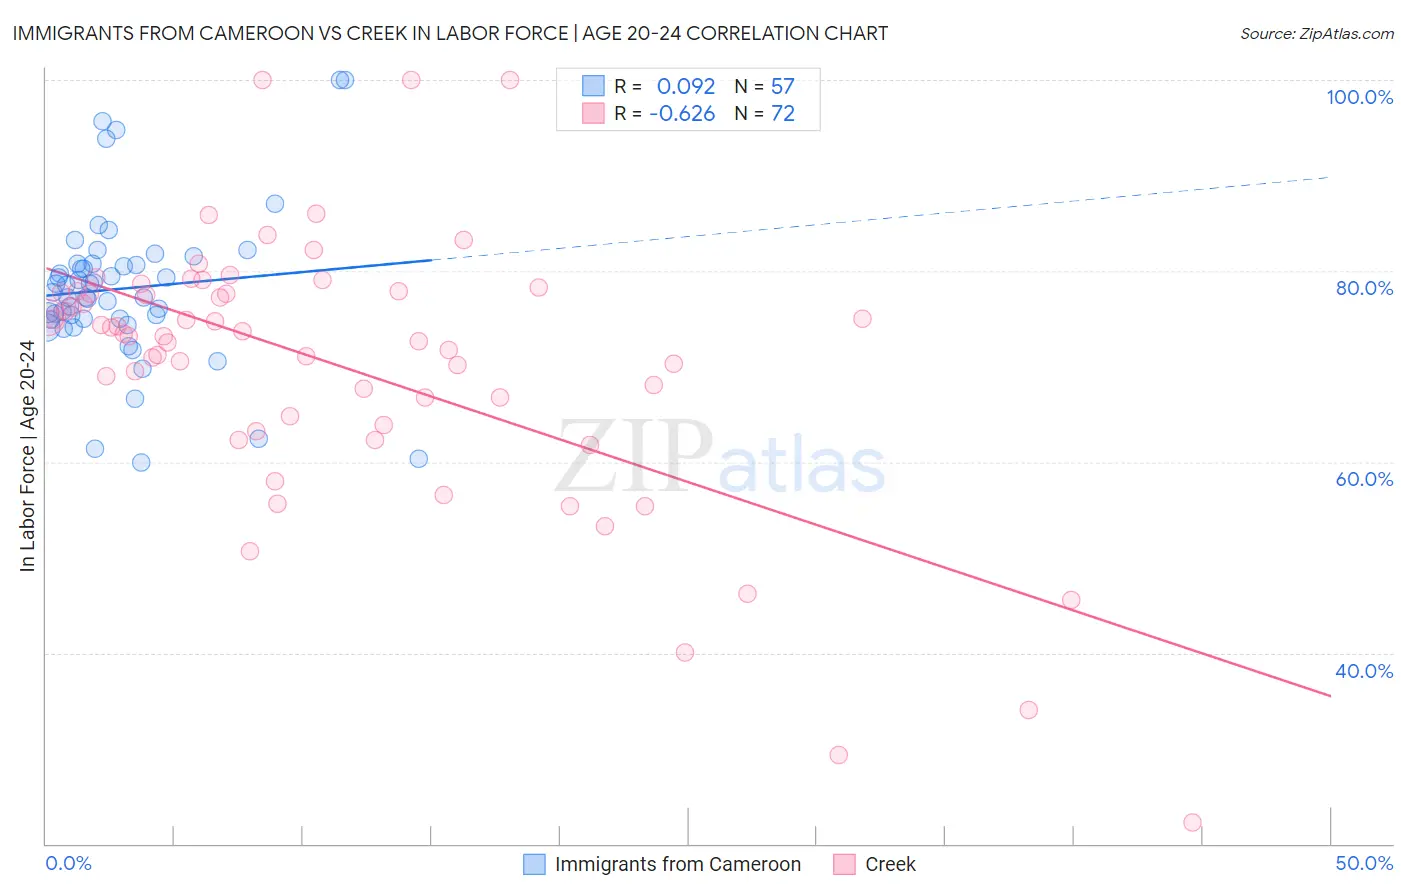
Immigrants from Cameroon vs Creek In Labor Force | Age 20-24 Correlation Chart
The statistical analysis conducted on geographies consisting of 130,759,306 people shows a slight positive correlation between the proportion of Immigrants from Cameroon and labor force participation rate among population between the ages 20 and 24 in the United States with a correlation coefficient (R) of 0.092 and weighted average of 76.6%. Similarly, the statistical analysis conducted on geographies consisting of 178,431,109 people shows a significant negative correlation between the proportion of Creek and labor force participation rate among population between the ages 20 and 24 in the United States with a correlation coefficient (R) of -0.626 and weighted average of 74.5%, a difference of 2.8%.
In Labor Force | Age 20-24 Correlation Summary
| Measurement | Immigrants from Cameroon | Creek |
| Minimum | 59.9% | 22.2% |
| Maximum | 100.0% | 100.0% |
| Range | 40.1% | 77.8% |
| Mean | 78.2% | 70.1% |
| Median | 77.8% | 73.3% |
| Interquartile 25% (IQ1) | 75.0% | 64.3% |
| Interquartile 75% (IQ3) | 80.7% | 77.8% |
| Interquartile Range (IQR) | 5.8% | 13.5% |
| Standard Deviation (Sample) | 8.2% | 14.3% |
| Standard Deviation (Population) | 8.1% | 14.2% |
Similar Demographics by In Labor Force | Age 20-24
Demographics Similar to Immigrants from Cameroon by In Labor Force | Age 20-24
In terms of in labor force | age 20-24, the demographic groups most similar to Immigrants from Cameroon are Canadian (76.6%, a difference of 0.0%), Immigrants from Zaire (76.6%, a difference of 0.020%), Immigrants from Moldova (76.6%, a difference of 0.030%), Italian (76.5%, a difference of 0.050%), and Immigrants from Middle Africa (76.6%, a difference of 0.070%).
| Demographics | Rating | Rank | In Labor Force | Age 20-24 |
| Ottawa | 99.8 /100 | #70 | Exceptional 76.8% |
| Northern Europeans | 99.8 /100 | #71 | Exceptional 76.8% |
| Guamanians/Chamorros | 99.8 /100 | #72 | Exceptional 76.7% |
| British | 99.8 /100 | #73 | Exceptional 76.7% |
| Cree | 99.7 /100 | #74 | Exceptional 76.6% |
| Immigrants | Middle Africa | 99.7 /100 | #75 | Exceptional 76.6% |
| Immigrants | Moldova | 99.6 /100 | #76 | Exceptional 76.6% |
| Immigrants | Cameroon | 99.6 /100 | #77 | Exceptional 76.6% |
| Canadians | 99.6 /100 | #78 | Exceptional 76.6% |
| Immigrants | Zaire | 99.6 /100 | #79 | Exceptional 76.6% |
| Italians | 99.6 /100 | #80 | Exceptional 76.5% |
| Basques | 99.5 /100 | #81 | Exceptional 76.5% |
| Hmong | 99.5 /100 | #82 | Exceptional 76.5% |
| Carpatho Rusyns | 99.4 /100 | #83 | Exceptional 76.5% |
| Austrians | 99.4 /100 | #84 | Exceptional 76.5% |
Demographics Similar to Creek by In Labor Force | Age 20-24
In terms of in labor force | age 20-24, the demographic groups most similar to Creek are Peruvian (74.5%, a difference of 0.0%), Immigrants from Southern Europe (74.5%, a difference of 0.0%), Immigrants from Ghana (74.5%, a difference of 0.020%), Immigrants from Kuwait (74.5%, a difference of 0.020%), and Chilean (74.5%, a difference of 0.030%).
| Demographics | Rating | Rank | In Labor Force | Age 20-24 |
| Inupiat | 17.6 /100 | #205 | Poor 74.6% |
| Sioux | 17.5 /100 | #206 | Poor 74.6% |
| Albanians | 16.2 /100 | #207 | Poor 74.6% |
| Immigrants | Uruguay | 15.8 /100 | #208 | Poor 74.6% |
| Arabs | 15.8 /100 | #209 | Poor 74.6% |
| Uruguayans | 15.1 /100 | #210 | Poor 74.6% |
| Immigrants | Australia | 14.7 /100 | #211 | Poor 74.6% |
| Creek | 13.3 /100 | #212 | Poor 74.5% |
| Peruvians | 13.3 /100 | #213 | Poor 74.5% |
| Immigrants | Southern Europe | 13.2 /100 | #214 | Poor 74.5% |
| Immigrants | Ghana | 12.7 /100 | #215 | Poor 74.5% |
| Immigrants | Kuwait | 12.7 /100 | #216 | Poor 74.5% |
| Chileans | 12.5 /100 | #217 | Poor 74.5% |
| Immigrants | Peru | 10.6 /100 | #218 | Poor 74.5% |
| Nepalese | 10.5 /100 | #219 | Poor 74.5% |