Iranian vs Egyptian In Labor Force | Age 20-24
COMPARE
Iranian
Egyptian
In Labor Force | Age 20-24
In Labor Force | Age 20-24 Comparison
Iranians
Egyptians
72.6%
IN LABOR FORCE | AGE 20-24
0.0/ 100
METRIC RATING
299th/ 347
METRIC RANK
73.7%
IN LABOR FORCE | AGE 20-24
0.7/ 100
METRIC RATING
258th/ 347
METRIC RANK
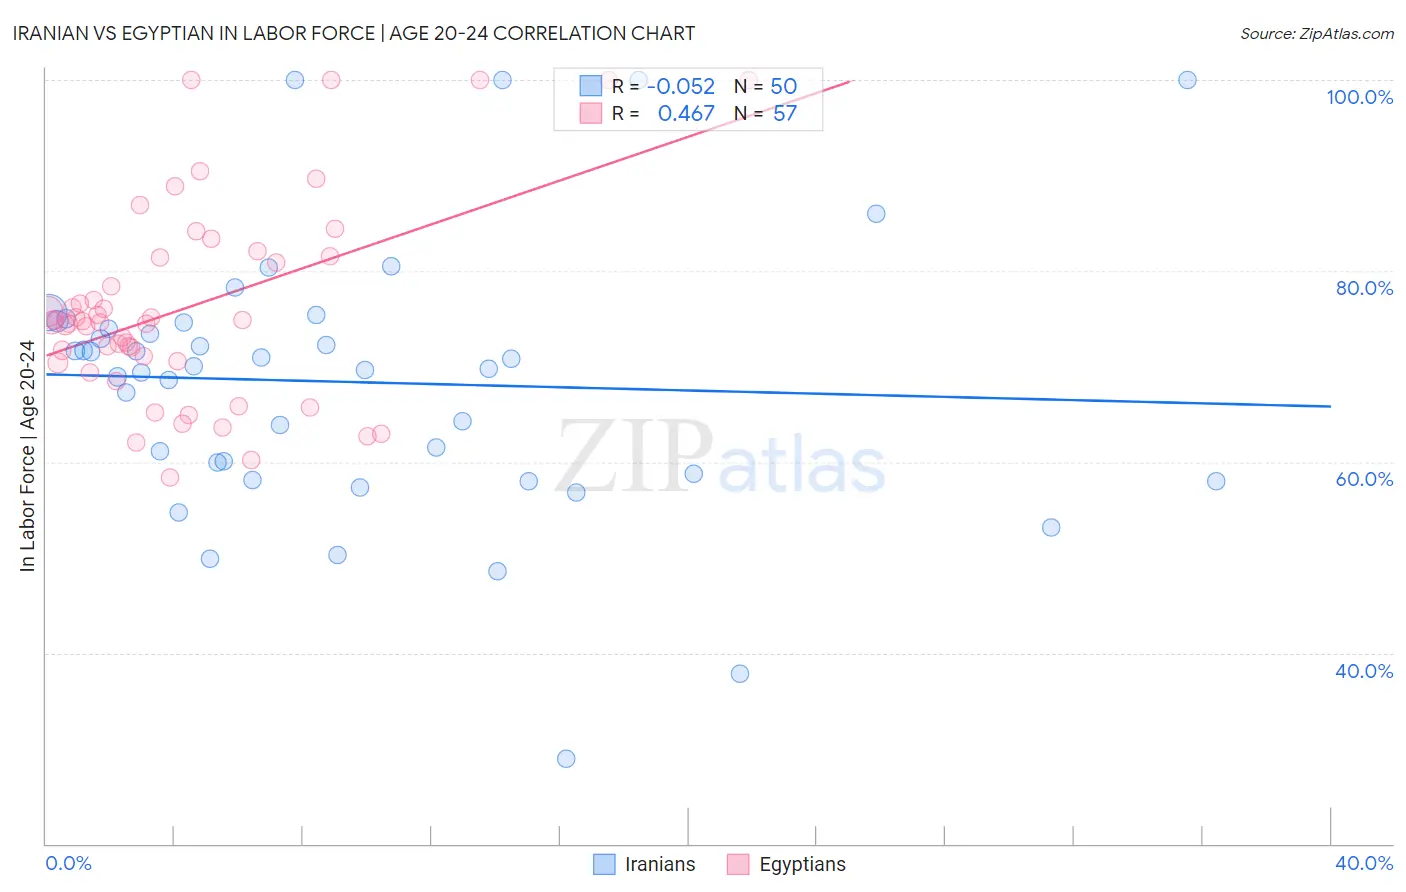
Iranian vs Egyptian In Labor Force | Age 20-24 Correlation Chart
The statistical analysis conducted on geographies consisting of 316,816,770 people shows a slight negative correlation between the proportion of Iranians and labor force participation rate among population between the ages 20 and 24 in the United States with a correlation coefficient (R) of -0.052 and weighted average of 72.6%. Similarly, the statistical analysis conducted on geographies consisting of 276,889,106 people shows a moderate positive correlation between the proportion of Egyptians and labor force participation rate among population between the ages 20 and 24 in the United States with a correlation coefficient (R) of 0.467 and weighted average of 73.7%, a difference of 1.6%.
In Labor Force | Age 20-24 Correlation Summary
| Measurement | Iranian | Egyptian |
| Minimum | 28.9% | 58.3% |
| Maximum | 100.0% | 100.0% |
| Range | 71.1% | 41.7% |
| Mean | 68.4% | 76.2% |
| Median | 69.9% | 74.6% |
| Interquartile 25% (IQ1) | 58.8% | 70.5% |
| Interquartile 75% (IQ3) | 74.6% | 81.5% |
| Interquartile Range (IQR) | 15.8% | 11.0% |
| Standard Deviation (Sample) | 14.3% | 10.4% |
| Standard Deviation (Population) | 14.2% | 10.3% |
Similar Demographics by In Labor Force | Age 20-24
Demographics Similar to Iranians by In Labor Force | Age 20-24
In terms of in labor force | age 20-24, the demographic groups most similar to Iranians are Armenian (72.5%, a difference of 0.020%), Israeli (72.6%, a difference of 0.040%), Cuban (72.5%, a difference of 0.090%), Central American Indian (72.7%, a difference of 0.17%), and Native/Alaskan (72.4%, a difference of 0.18%).
| Demographics | Rating | Rank | In Labor Force | Age 20-24 |
| Pueblo | 0.0 /100 | #292 | Tragic 72.9% |
| Immigrants | Belize | 0.0 /100 | #293 | Tragic 72.8% |
| Immigrants | Argentina | 0.0 /100 | #294 | Tragic 72.8% |
| Okinawans | 0.0 /100 | #295 | Tragic 72.7% |
| Jamaicans | 0.0 /100 | #296 | Tragic 72.7% |
| Central American Indians | 0.0 /100 | #297 | Tragic 72.7% |
| Israelis | 0.0 /100 | #298 | Tragic 72.6% |
| Iranians | 0.0 /100 | #299 | Tragic 72.6% |
| Armenians | 0.0 /100 | #300 | Tragic 72.5% |
| Cubans | 0.0 /100 | #301 | Tragic 72.5% |
| Natives/Alaskans | 0.0 /100 | #302 | Tragic 72.4% |
| Ecuadorians | 0.0 /100 | #303 | Tragic 72.4% |
| Immigrants | West Indies | 0.0 /100 | #304 | Tragic 72.4% |
| Immigrants | Singapore | 0.0 /100 | #305 | Tragic 72.4% |
| Immigrants | Jamaica | 0.0 /100 | #306 | Tragic 72.4% |
Demographics Similar to Egyptians by In Labor Force | Age 20-24
In terms of in labor force | age 20-24, the demographic groups most similar to Egyptians are Dutch West Indian (73.7%, a difference of 0.0%), Immigrants from Turkey (73.7%, a difference of 0.030%), Paraguayan (73.7%, a difference of 0.040%), Houma (73.7%, a difference of 0.040%), and Asian (73.7%, a difference of 0.050%).
| Demographics | Rating | Rank | In Labor Force | Age 20-24 |
| Immigrants | Egypt | 1.2 /100 | #251 | Tragic 73.8% |
| Immigrants | Kazakhstan | 1.1 /100 | #252 | Tragic 73.8% |
| Arapaho | 1.0 /100 | #253 | Tragic 73.8% |
| Ute | 1.0 /100 | #254 | Tragic 73.8% |
| Immigrants | Pakistan | 0.9 /100 | #255 | Tragic 73.8% |
| Spanish American Indians | 0.8 /100 | #256 | Tragic 73.7% |
| Paraguayans | 0.8 /100 | #257 | Tragic 73.7% |
| Egyptians | 0.7 /100 | #258 | Tragic 73.7% |
| Dutch West Indians | 0.7 /100 | #259 | Tragic 73.7% |
| Immigrants | Turkey | 0.7 /100 | #260 | Tragic 73.7% |
| Houma | 0.6 /100 | #261 | Tragic 73.7% |
| Asians | 0.6 /100 | #262 | Tragic 73.7% |
| Immigrants | Asia | 0.5 /100 | #263 | Tragic 73.6% |
| Immigrants | Haiti | 0.5 /100 | #264 | Tragic 73.6% |
| Burmese | 0.5 /100 | #265 | Tragic 73.6% |