Iranian vs Creek Family Households
COMPARE
Iranian
Creek
Family Households
Family Households Comparison
Iranians
Creek
63.9%
FAMILY HOUSEHOLDS
13.5/ 100
METRIC RATING
202nd/ 347
METRIC RANK
64.2%
FAMILY HOUSEHOLDS
34.1/ 100
METRIC RATING
183rd/ 347
METRIC RANK
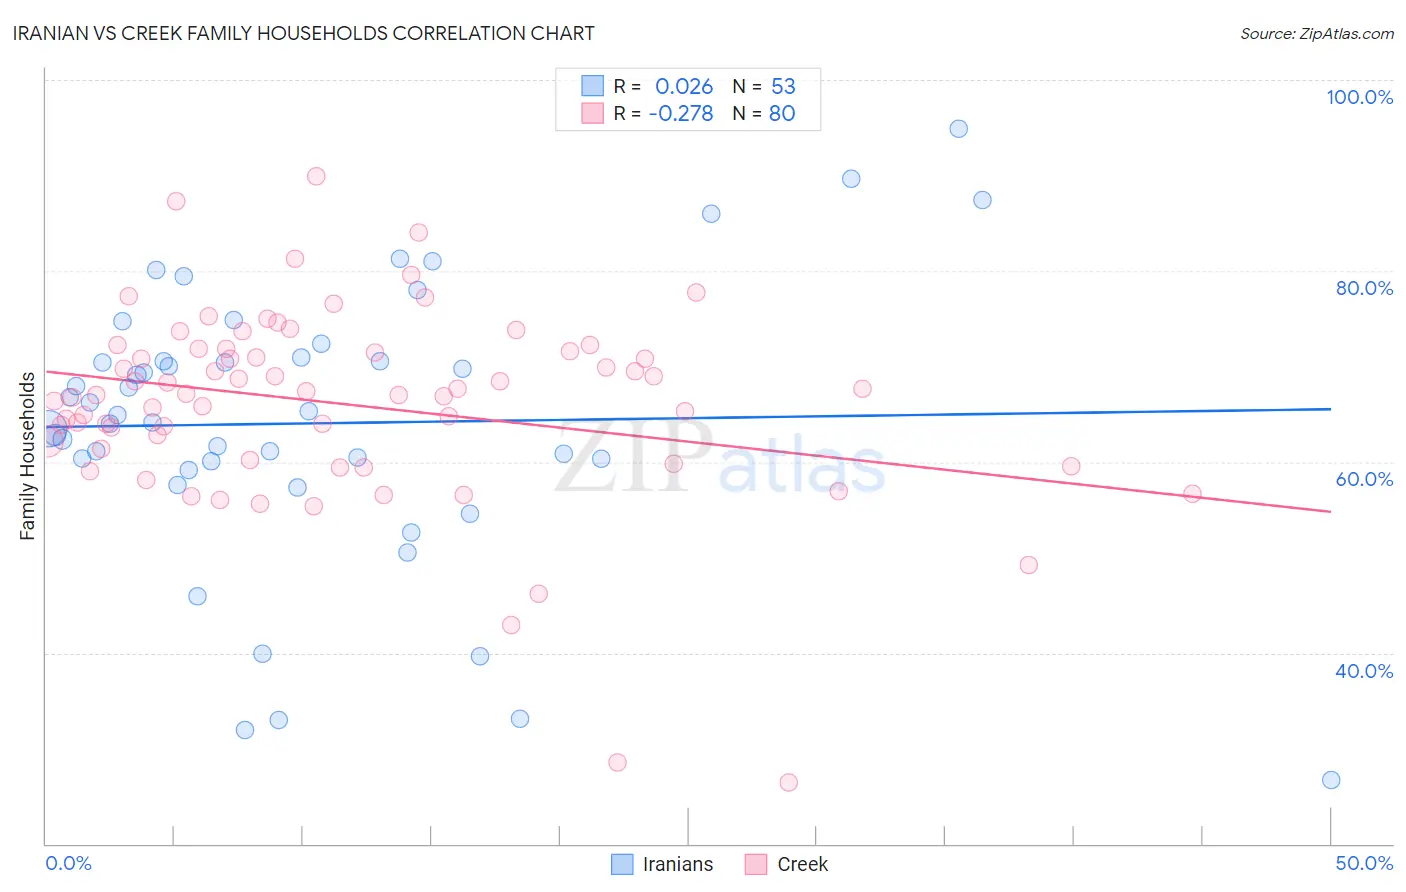
Iranian vs Creek Family Households Correlation Chart
The statistical analysis conducted on geographies consisting of 316,654,989 people shows no correlation between the proportion of Iranians and percentage of family households in the United States with a correlation coefficient (R) of 0.026 and weighted average of 63.9%. Similarly, the statistical analysis conducted on geographies consisting of 178,433,480 people shows a weak negative correlation between the proportion of Creek and percentage of family households in the United States with a correlation coefficient (R) of -0.278 and weighted average of 64.2%, a difference of 0.40%.
Family Households Correlation Summary
| Measurement | Iranian | Creek |
| Minimum | 26.7% | 26.4% |
| Maximum | 94.9% | 89.9% |
| Range | 68.2% | 63.5% |
| Mean | 64.0% | 66.0% |
| Median | 64.9% | 67.1% |
| Interquartile 25% (IQ1) | 59.6% | 60.8% |
| Interquartile 75% (IQ3) | 70.7% | 71.7% |
| Interquartile Range (IQR) | 11.2% | 10.9% |
| Standard Deviation (Sample) | 14.6% | 10.4% |
| Standard Deviation (Population) | 14.4% | 10.3% |
Demographics Similar to Iranians and Creek by Family Households
In terms of family households, the demographic groups most similar to Iranians are Immigrants from Eastern Europe (64.0%, a difference of 0.10%), Immigrants from Malaysia (64.0%, a difference of 0.11%), Slavic (64.0%, a difference of 0.13%), Immigrants from Canada (64.0%, a difference of 0.14%), and Seminole (64.0%, a difference of 0.14%). Similarly, the demographic groups most similar to Creek are Ukrainian (64.2%, a difference of 0.010%), Puerto Rican (64.2%, a difference of 0.010%), Immigrants from Iran (64.1%, a difference of 0.060%), Spanish American (64.1%, a difference of 0.060%), and Northern European (64.1%, a difference of 0.090%).
| Demographics | Rating | Rank | Family Households |
| Ukrainians | 34.6 /100 | #182 | Fair 64.2% |
| Creek | 34.1 /100 | #183 | Fair 64.2% |
| Puerto Ricans | 33.4 /100 | #184 | Fair 64.2% |
| Immigrants | Iran | 30.4 /100 | #185 | Fair 64.1% |
| Spanish Americans | 30.1 /100 | #186 | Fair 64.1% |
| Northern Europeans | 28.2 /100 | #187 | Fair 64.1% |
| Paraguayans | 26.7 /100 | #188 | Fair 64.1% |
| Immigrants | Western Asia | 25.3 /100 | #189 | Fair 64.1% |
| Zimbabweans | 24.7 /100 | #190 | Fair 64.1% |
| Arabs | 24.5 /100 | #191 | Fair 64.1% |
| Lithuanians | 23.8 /100 | #192 | Fair 64.0% |
| French | 23.7 /100 | #193 | Fair 64.0% |
| Paiute | 22.2 /100 | #194 | Fair 64.0% |
| Immigrants | North America | 20.0 /100 | #195 | Poor 64.0% |
| Immigrants | Canada | 19.2 /100 | #196 | Poor 64.0% |
| Seminole | 18.9 /100 | #197 | Poor 64.0% |
| Poles | 18.9 /100 | #198 | Poor 64.0% |
| Slavs | 18.6 /100 | #199 | Poor 64.0% |
| Immigrants | Malaysia | 17.9 /100 | #200 | Poor 64.0% |
| Immigrants | Eastern Europe | 17.2 /100 | #201 | Poor 64.0% |
| Iranians | 13.5 /100 | #202 | Poor 63.9% |