Iranian vs Immigrants from Syria In Labor Force | Age 20-24
COMPARE
Iranian
Immigrants from Syria
In Labor Force | Age 20-24
In Labor Force | Age 20-24 Comparison
Iranians
Immigrants from Syria
72.6%
IN LABOR FORCE | AGE 20-24
0.0/ 100
METRIC RATING
299th/ 347
METRIC RANK
74.0%
IN LABOR FORCE | AGE 20-24
1.9/ 100
METRIC RATING
243rd/ 347
METRIC RANK
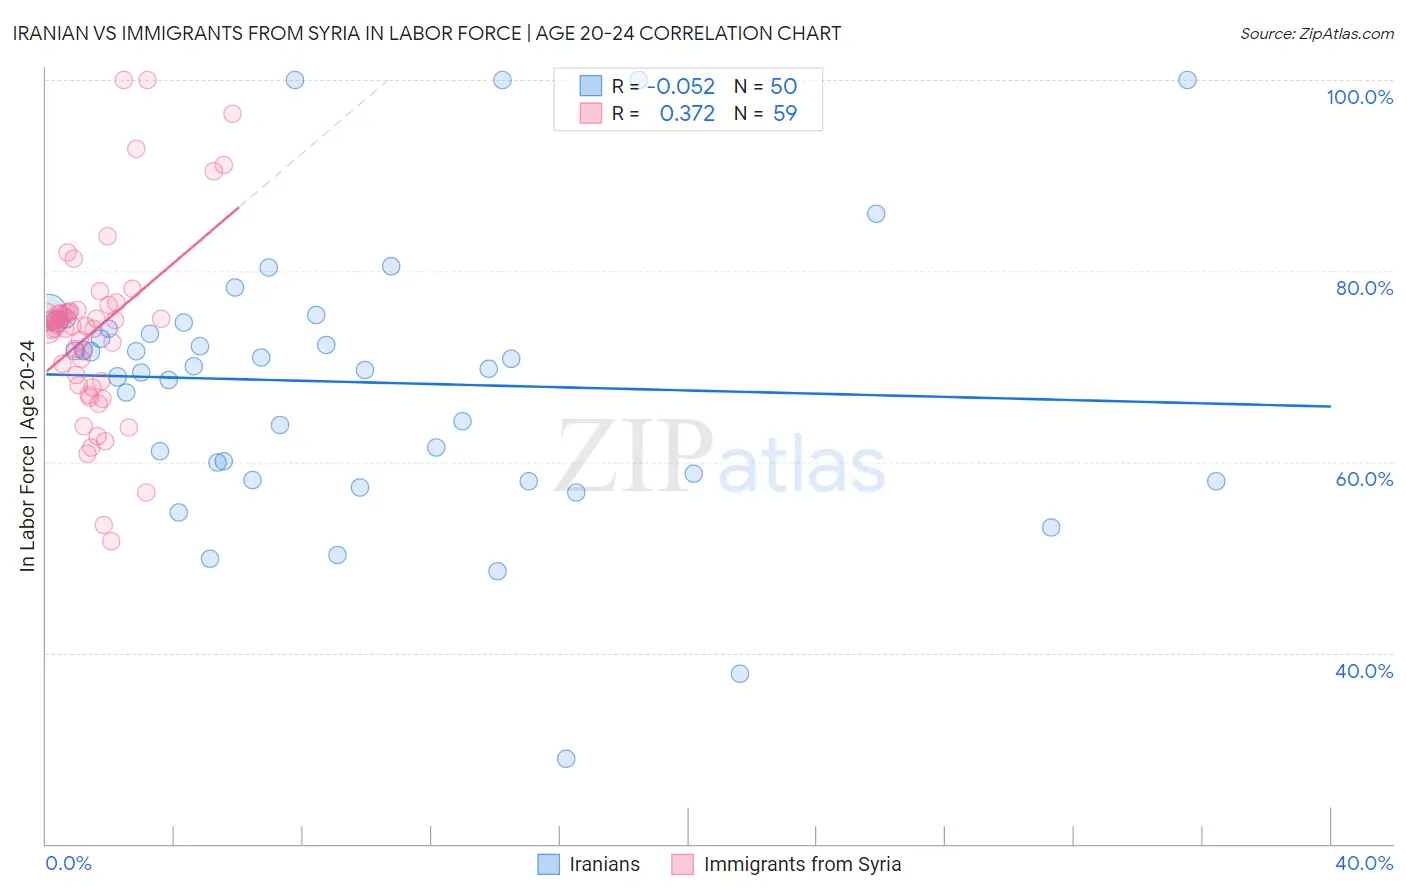
Iranian vs Immigrants from Syria In Labor Force | Age 20-24 Correlation Chart
The statistical analysis conducted on geographies consisting of 316,816,770 people shows a slight negative correlation between the proportion of Iranians and labor force participation rate among population between the ages 20 and 24 in the United States with a correlation coefficient (R) of -0.052 and weighted average of 72.6%. Similarly, the statistical analysis conducted on geographies consisting of 174,096,608 people shows a mild positive correlation between the proportion of Immigrants from Syria and labor force participation rate among population between the ages 20 and 24 in the United States with a correlation coefficient (R) of 0.372 and weighted average of 74.0%, a difference of 1.9%.
In Labor Force | Age 20-24 Correlation Summary
| Measurement | Iranian | Immigrants from Syria |
| Minimum | 28.9% | 51.7% |
| Maximum | 100.0% | 100.0% |
| Range | 71.1% | 48.3% |
| Mean | 68.4% | 73.8% |
| Median | 69.9% | 74.2% |
| Interquartile 25% (IQ1) | 58.8% | 68.0% |
| Interquartile 75% (IQ3) | 74.6% | 75.7% |
| Interquartile Range (IQR) | 15.8% | 7.7% |
| Standard Deviation (Sample) | 14.3% | 9.7% |
| Standard Deviation (Population) | 14.2% | 9.6% |
Similar Demographics by In Labor Force | Age 20-24
Demographics Similar to Iranians by In Labor Force | Age 20-24
In terms of in labor force | age 20-24, the demographic groups most similar to Iranians are Armenian (72.5%, a difference of 0.020%), Israeli (72.6%, a difference of 0.040%), Cuban (72.5%, a difference of 0.090%), Central American Indian (72.7%, a difference of 0.17%), and Native/Alaskan (72.4%, a difference of 0.18%).
| Demographics | Rating | Rank | In Labor Force | Age 20-24 |
| Pueblo | 0.0 /100 | #292 | Tragic 72.9% |
| Immigrants | Belize | 0.0 /100 | #293 | Tragic 72.8% |
| Immigrants | Argentina | 0.0 /100 | #294 | Tragic 72.8% |
| Okinawans | 0.0 /100 | #295 | Tragic 72.7% |
| Jamaicans | 0.0 /100 | #296 | Tragic 72.7% |
| Central American Indians | 0.0 /100 | #297 | Tragic 72.7% |
| Israelis | 0.0 /100 | #298 | Tragic 72.6% |
| Iranians | 0.0 /100 | #299 | Tragic 72.6% |
| Armenians | 0.0 /100 | #300 | Tragic 72.5% |
| Cubans | 0.0 /100 | #301 | Tragic 72.5% |
| Natives/Alaskans | 0.0 /100 | #302 | Tragic 72.4% |
| Ecuadorians | 0.0 /100 | #303 | Tragic 72.4% |
| Immigrants | West Indies | 0.0 /100 | #304 | Tragic 72.4% |
| Immigrants | Singapore | 0.0 /100 | #305 | Tragic 72.4% |
| Immigrants | Jamaica | 0.0 /100 | #306 | Tragic 72.4% |
Demographics Similar to Immigrants from Syria by In Labor Force | Age 20-24
In terms of in labor force | age 20-24, the demographic groups most similar to Immigrants from Syria are Immigrants from South Central Asia (74.0%, a difference of 0.010%), Thai (74.0%, a difference of 0.030%), Turkish (73.9%, a difference of 0.030%), Immigrants from Senegal (74.0%, a difference of 0.040%), and Immigrants from Sri Lanka (74.0%, a difference of 0.070%).
| Demographics | Rating | Rank | In Labor Force | Age 20-24 |
| Immigrants | France | 3.3 /100 | #236 | Tragic 74.1% |
| Bermudans | 3.2 /100 | #237 | Tragic 74.1% |
| Immigrants | Japan | 3.0 /100 | #238 | Tragic 74.1% |
| Immigrants | Latin America | 2.7 /100 | #239 | Tragic 74.1% |
| Immigrants | Sri Lanka | 2.3 /100 | #240 | Tragic 74.0% |
| Immigrants | Senegal | 2.1 /100 | #241 | Tragic 74.0% |
| Thais | 2.1 /100 | #242 | Tragic 74.0% |
| Immigrants | Syria | 1.9 /100 | #243 | Tragic 74.0% |
| Immigrants | South Central Asia | 1.9 /100 | #244 | Tragic 74.0% |
| Turks | 1.8 /100 | #245 | Tragic 73.9% |
| Immigrants | Panama | 1.6 /100 | #246 | Tragic 73.9% |
| Colville | 1.5 /100 | #247 | Tragic 73.9% |
| Immigrants | Saudi Arabia | 1.5 /100 | #248 | Tragic 73.9% |
| Blacks/African Americans | 1.3 /100 | #249 | Tragic 73.9% |
| Immigrants | Belgium | 1.3 /100 | #250 | Tragic 73.9% |