Mexican American Indian vs Creek In Labor Force | Age 20-24
COMPARE
Mexican American Indian
Creek
In Labor Force | Age 20-24
In Labor Force | Age 20-24 Comparison
Mexican American Indians
Creek
75.4%
IN LABOR FORCE | AGE 20-24
78.8/ 100
METRIC RATING
146th/ 347
METRIC RANK
74.5%
IN LABOR FORCE | AGE 20-24
13.3/ 100
METRIC RATING
212th/ 347
METRIC RANK
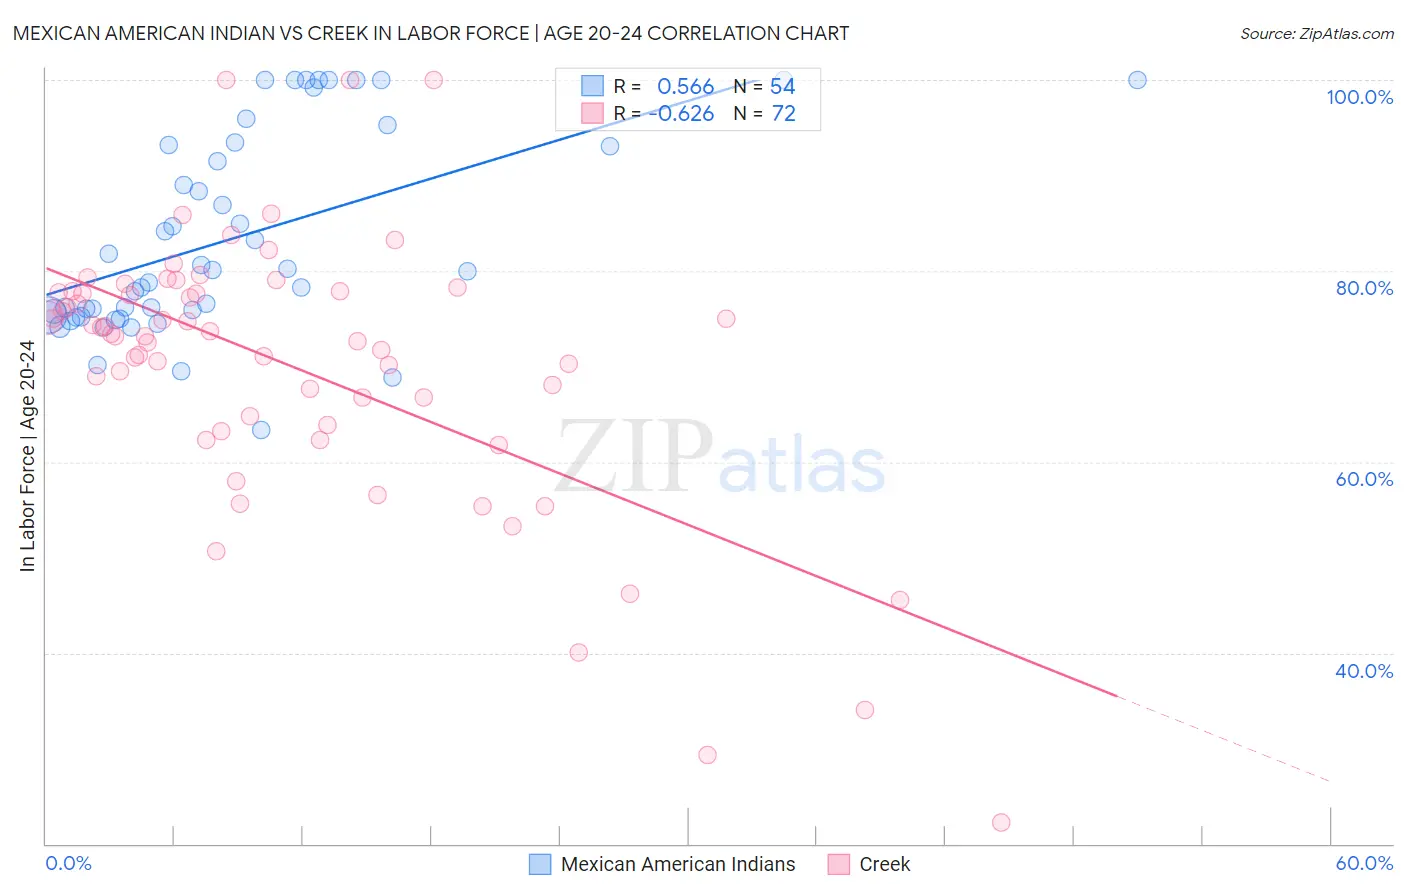
Mexican American Indian vs Creek In Labor Force | Age 20-24 Correlation Chart
The statistical analysis conducted on geographies consisting of 317,521,579 people shows a substantial positive correlation between the proportion of Mexican American Indians and labor force participation rate among population between the ages 20 and 24 in the United States with a correlation coefficient (R) of 0.566 and weighted average of 75.4%. Similarly, the statistical analysis conducted on geographies consisting of 178,431,109 people shows a significant negative correlation between the proportion of Creek and labor force participation rate among population between the ages 20 and 24 in the United States with a correlation coefficient (R) of -0.626 and weighted average of 74.5%, a difference of 1.2%.
In Labor Force | Age 20-24 Correlation Summary
| Measurement | Mexican American Indian | Creek |
| Minimum | 63.3% | 22.2% |
| Maximum | 100.0% | 100.0% |
| Range | 36.7% | 77.8% |
| Mean | 83.4% | 70.1% |
| Median | 80.1% | 73.3% |
| Interquartile 25% (IQ1) | 75.4% | 64.3% |
| Interquartile 75% (IQ3) | 93.1% | 77.8% |
| Interquartile Range (IQR) | 17.7% | 13.5% |
| Standard Deviation (Sample) | 10.4% | 14.3% |
| Standard Deviation (Population) | 10.3% | 14.2% |
Similar Demographics by In Labor Force | Age 20-24
Demographics Similar to Mexican American Indians by In Labor Force | Age 20-24
In terms of in labor force | age 20-24, the demographic groups most similar to Mexican American Indians are Korean (75.4%, a difference of 0.020%), Comanche (75.4%, a difference of 0.030%), Immigrants from Cambodia (75.4%, a difference of 0.040%), Bhutanese (75.4%, a difference of 0.050%), and Ugandan (75.4%, a difference of 0.060%).
| Demographics | Rating | Rank | In Labor Force | Age 20-24 |
| Immigrants | England | 84.6 /100 | #139 | Excellent 75.5% |
| Delaware | 84.5 /100 | #140 | Excellent 75.5% |
| Romanians | 84.1 /100 | #141 | Excellent 75.5% |
| Blackfeet | 83.6 /100 | #142 | Excellent 75.5% |
| Spaniards | 82.0 /100 | #143 | Excellent 75.5% |
| Bhutanese | 80.8 /100 | #144 | Excellent 75.4% |
| Koreans | 79.7 /100 | #145 | Good 75.4% |
| Mexican American Indians | 78.8 /100 | #146 | Good 75.4% |
| Comanche | 77.6 /100 | #147 | Good 75.4% |
| Immigrants | Cambodia | 76.7 /100 | #148 | Good 75.4% |
| Ugandans | 76.1 /100 | #149 | Good 75.4% |
| Salvadorans | 74.8 /100 | #150 | Good 75.3% |
| Paiute | 74.1 /100 | #151 | Good 75.3% |
| Lebanese | 73.5 /100 | #152 | Good 75.3% |
| Guatemalans | 72.3 /100 | #153 | Good 75.3% |
Demographics Similar to Creek by In Labor Force | Age 20-24
In terms of in labor force | age 20-24, the demographic groups most similar to Creek are Peruvian (74.5%, a difference of 0.0%), Immigrants from Southern Europe (74.5%, a difference of 0.0%), Immigrants from Ghana (74.5%, a difference of 0.020%), Immigrants from Kuwait (74.5%, a difference of 0.020%), and Chilean (74.5%, a difference of 0.030%).
| Demographics | Rating | Rank | In Labor Force | Age 20-24 |
| Inupiat | 17.6 /100 | #205 | Poor 74.6% |
| Sioux | 17.5 /100 | #206 | Poor 74.6% |
| Albanians | 16.2 /100 | #207 | Poor 74.6% |
| Immigrants | Uruguay | 15.8 /100 | #208 | Poor 74.6% |
| Arabs | 15.8 /100 | #209 | Poor 74.6% |
| Uruguayans | 15.1 /100 | #210 | Poor 74.6% |
| Immigrants | Australia | 14.7 /100 | #211 | Poor 74.6% |
| Creek | 13.3 /100 | #212 | Poor 74.5% |
| Peruvians | 13.3 /100 | #213 | Poor 74.5% |
| Immigrants | Southern Europe | 13.2 /100 | #214 | Poor 74.5% |
| Immigrants | Ghana | 12.7 /100 | #215 | Poor 74.5% |
| Immigrants | Kuwait | 12.7 /100 | #216 | Poor 74.5% |
| Chileans | 12.5 /100 | #217 | Poor 74.5% |
| Immigrants | Peru | 10.6 /100 | #218 | Poor 74.5% |
| Nepalese | 10.5 /100 | #219 | Poor 74.5% |