Iranian vs Immigrants from Israel In Labor Force | Age 25-29
COMPARE
Iranian
Immigrants from Israel
In Labor Force | Age 25-29
In Labor Force | Age 25-29 Comparison
Iranians
Immigrants from Israel
84.8%
IN LABOR FORCE | AGE 25-29
78.1/ 100
METRIC RATING
131st/ 347
METRIC RANK
84.4%
IN LABOR FORCE | AGE 25-29
20.8/ 100
METRIC RATING
195th/ 347
METRIC RANK
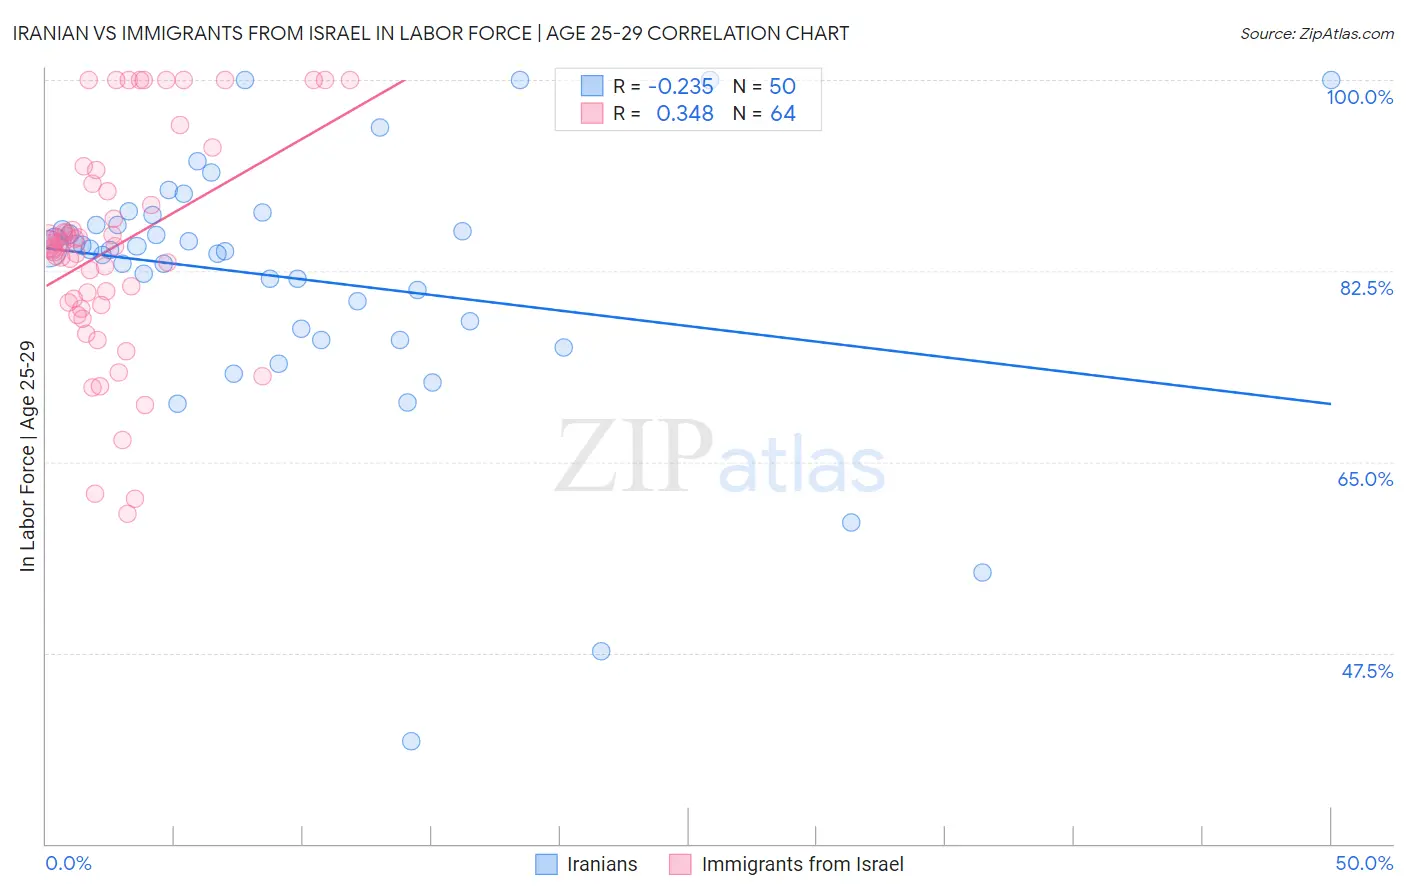
Iranian vs Immigrants from Israel In Labor Force | Age 25-29 Correlation Chart
The statistical analysis conducted on geographies consisting of 316,808,668 people shows a weak negative correlation between the proportion of Iranians and labor force participation rate among population between the ages 25 and 29 in the United States with a correlation coefficient (R) of -0.235 and weighted average of 84.8%. Similarly, the statistical analysis conducted on geographies consisting of 209,997,538 people shows a mild positive correlation between the proportion of Immigrants from Israel and labor force participation rate among population between the ages 25 and 29 in the United States with a correlation coefficient (R) of 0.348 and weighted average of 84.4%, a difference of 0.48%.
In Labor Force | Age 25-29 Correlation Summary
| Measurement | Iranian | Immigrants from Israel |
| Minimum | 39.4% | 60.3% |
| Maximum | 100.0% | 100.0% |
| Range | 60.6% | 39.7% |
| Mean | 81.8% | 84.7% |
| Median | 84.5% | 84.8% |
| Interquartile 25% (IQ1) | 77.2% | 79.5% |
| Interquartile 75% (IQ3) | 86.7% | 90.2% |
| Interquartile Range (IQR) | 9.6% | 10.7% |
| Standard Deviation (Sample) | 11.9% | 9.9% |
| Standard Deviation (Population) | 11.8% | 9.9% |
Similar Demographics by In Labor Force | Age 25-29
Demographics Similar to Iranians by In Labor Force | Age 25-29
In terms of in labor force | age 25-29, the demographic groups most similar to Iranians are Romanian (84.8%, a difference of 0.0%), Asian (84.8%, a difference of 0.0%), Syrian (84.8%, a difference of 0.020%), Immigrants from Hungary (84.8%, a difference of 0.020%), and Bhutanese (84.8%, a difference of 0.020%).
| Demographics | Rating | Rank | In Labor Force | Age 25-29 |
| Immigrants | Iran | 84.8 /100 | #124 | Excellent 84.9% |
| Uruguayans | 84.7 /100 | #125 | Excellent 84.9% |
| Immigrants | Singapore | 84.4 /100 | #126 | Excellent 84.9% |
| Immigrants | Uruguay | 84.0 /100 | #127 | Excellent 84.9% |
| Australians | 83.6 /100 | #128 | Excellent 84.9% |
| Immigrants | Russia | 81.6 /100 | #129 | Excellent 84.9% |
| Northern Europeans | 81.3 /100 | #130 | Excellent 84.9% |
| Iranians | 78.1 /100 | #131 | Good 84.8% |
| Romanians | 77.7 /100 | #132 | Good 84.8% |
| Asians | 77.7 /100 | #133 | Good 84.8% |
| Syrians | 76.5 /100 | #134 | Good 84.8% |
| Immigrants | Hungary | 76.4 /100 | #135 | Good 84.8% |
| Bhutanese | 76.0 /100 | #136 | Good 84.8% |
| Immigrants | Canada | 73.5 /100 | #137 | Good 84.8% |
| Armenians | 72.7 /100 | #138 | Good 84.8% |
Demographics Similar to Immigrants from Israel by In Labor Force | Age 25-29
In terms of in labor force | age 25-29, the demographic groups most similar to Immigrants from Israel are Portuguese (84.4%, a difference of 0.010%), Immigrants from South Eastern Asia (84.4%, a difference of 0.010%), Tlingit-Haida (84.4%, a difference of 0.020%), Immigrants from Iraq (84.4%, a difference of 0.020%), and Immigrants from Germany (84.4%, a difference of 0.030%).
| Demographics | Rating | Rank | In Labor Force | Age 25-29 |
| Immigrants | Ukraine | 33.7 /100 | #188 | Fair 84.5% |
| Moroccans | 32.6 /100 | #189 | Fair 84.5% |
| Welsh | 31.1 /100 | #190 | Fair 84.5% |
| Zimbabweans | 28.7 /100 | #191 | Fair 84.5% |
| English | 25.8 /100 | #192 | Fair 84.5% |
| South American Indians | 25.0 /100 | #193 | Fair 84.5% |
| Portuguese | 21.2 /100 | #194 | Fair 84.4% |
| Immigrants | Israel | 20.8 /100 | #195 | Fair 84.4% |
| Immigrants | South Eastern Asia | 19.5 /100 | #196 | Poor 84.4% |
| Tlingit-Haida | 19.3 /100 | #197 | Poor 84.4% |
| Immigrants | Iraq | 19.0 /100 | #198 | Poor 84.4% |
| Immigrants | Germany | 18.3 /100 | #199 | Poor 84.4% |
| Immigrants | Kazakhstan | 17.5 /100 | #200 | Poor 84.4% |
| Laotians | 16.6 /100 | #201 | Poor 84.4% |
| Afghans | 15.9 /100 | #202 | Poor 84.4% |