Immigrants from Venezuela vs Central American Indian In Labor Force | Age 25-29
COMPARE
Immigrants from Venezuela
Central American Indian
In Labor Force | Age 25-29
In Labor Force | Age 25-29 Comparison
Immigrants from Venezuela
Central American Indians
84.3%
IN LABOR FORCE | AGE 25-29
12.6/ 100
METRIC RATING
211th/ 347
METRIC RANK
82.4%
IN LABOR FORCE | AGE 25-29
0.0/ 100
METRIC RATING
308th/ 347
METRIC RANK
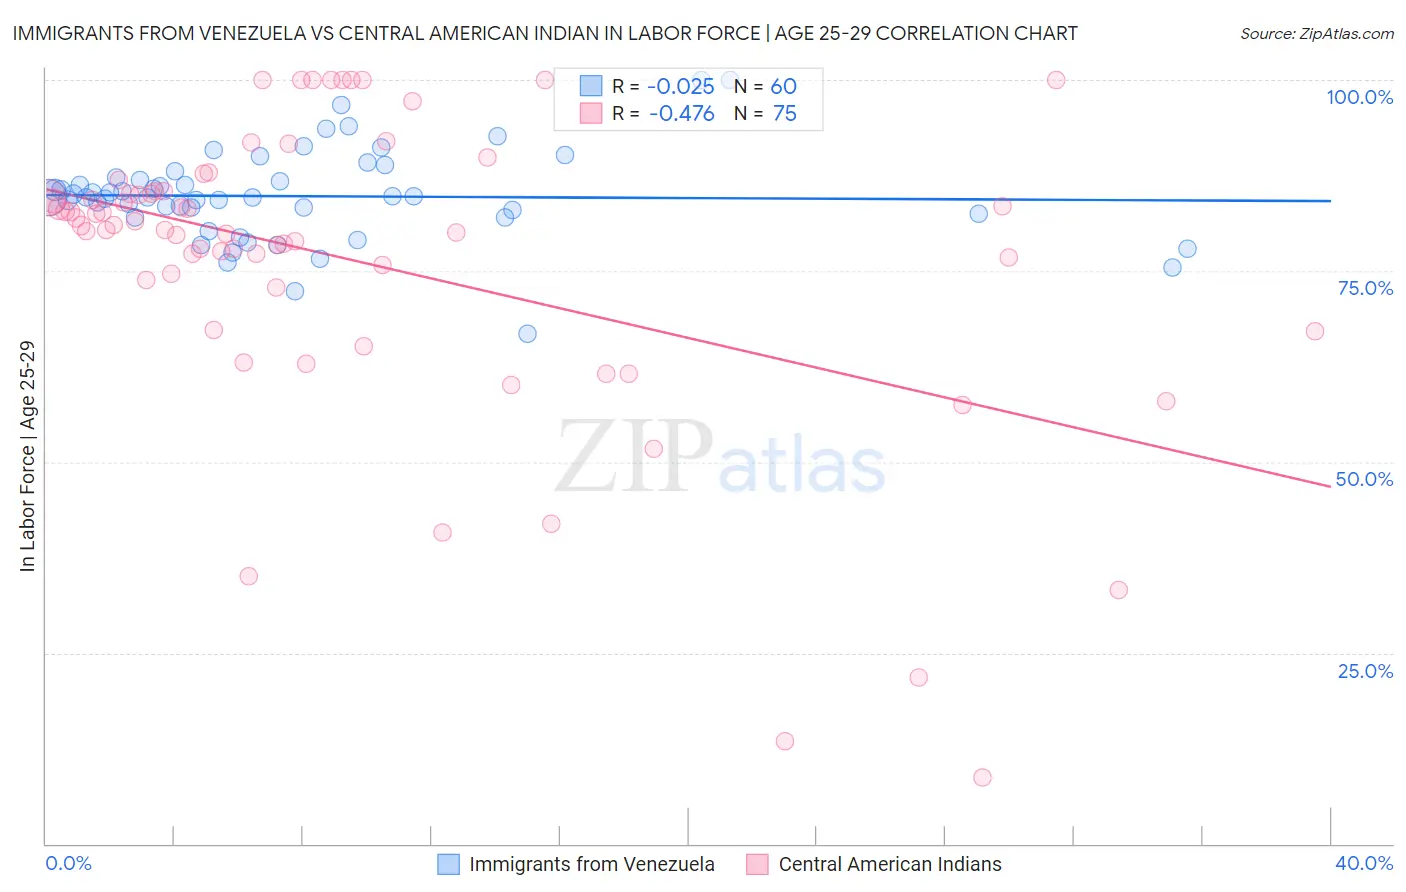
Immigrants from Venezuela vs Central American Indian In Labor Force | Age 25-29 Correlation Chart
The statistical analysis conducted on geographies consisting of 287,835,027 people shows no correlation between the proportion of Immigrants from Venezuela and labor force participation rate among population between the ages 25 and 29 in the United States with a correlation coefficient (R) of -0.025 and weighted average of 84.3%. Similarly, the statistical analysis conducted on geographies consisting of 326,098,631 people shows a moderate negative correlation between the proportion of Central American Indians and labor force participation rate among population between the ages 25 and 29 in the United States with a correlation coefficient (R) of -0.476 and weighted average of 82.4%, a difference of 2.3%.
In Labor Force | Age 25-29 Correlation Summary
| Measurement | Immigrants from Venezuela | Central American Indian |
| Minimum | 66.7% | 8.6% |
| Maximum | 100.0% | 100.0% |
| Range | 33.3% | 91.4% |
| Mean | 84.8% | 76.3% |
| Median | 84.7% | 80.9% |
| Interquartile 25% (IQ1) | 82.3% | 72.9% |
| Interquartile 75% (IQ3) | 87.1% | 85.4% |
| Interquartile Range (IQR) | 4.8% | 12.5% |
| Standard Deviation (Sample) | 6.0% | 19.5% |
| Standard Deviation (Population) | 5.9% | 19.4% |
Similar Demographics by In Labor Force | Age 25-29
Demographics Similar to Immigrants from Venezuela by In Labor Force | Age 25-29
In terms of in labor force | age 25-29, the demographic groups most similar to Immigrants from Venezuela are Immigrants from Jordan (84.4%, a difference of 0.0%), Chinese (84.3%, a difference of 0.0%), Immigrants from Armenia (84.4%, a difference of 0.010%), Immigrants from Indonesia (84.4%, a difference of 0.010%), and Subsaharan African (84.3%, a difference of 0.020%).
| Demographics | Rating | Rank | In Labor Force | Age 25-29 |
| Venezuelans | 15.1 /100 | #204 | Poor 84.4% |
| Ecuadorians | 14.8 /100 | #205 | Poor 84.4% |
| Immigrants | Cambodia | 14.3 /100 | #206 | Poor 84.4% |
| Immigrants | Armenia | 13.3 /100 | #207 | Poor 84.4% |
| Immigrants | Indonesia | 13.2 /100 | #208 | Poor 84.4% |
| Immigrants | Jordan | 12.8 /100 | #209 | Poor 84.4% |
| Chinese | 12.7 /100 | #210 | Poor 84.3% |
| Immigrants | Venezuela | 12.6 /100 | #211 | Poor 84.3% |
| Sub-Saharan Africans | 11.7 /100 | #212 | Poor 84.3% |
| Japanese | 11.4 /100 | #213 | Poor 84.3% |
| Lebanese | 11.1 /100 | #214 | Poor 84.3% |
| Immigrants | Syria | 10.7 /100 | #215 | Poor 84.3% |
| Israelis | 9.3 /100 | #216 | Tragic 84.3% |
| Immigrants | Ecuador | 9.3 /100 | #217 | Tragic 84.3% |
| Immigrants | Nigeria | 9.0 /100 | #218 | Tragic 84.3% |
Demographics Similar to Central American Indians by In Labor Force | Age 25-29
In terms of in labor force | age 25-29, the demographic groups most similar to Central American Indians are Immigrants from Central America (82.4%, a difference of 0.010%), Cajun (82.5%, a difference of 0.15%), Osage (82.3%, a difference of 0.15%), Alaskan Athabascan (82.3%, a difference of 0.16%), and Black/African American (82.6%, a difference of 0.21%).
| Demographics | Rating | Rank | In Labor Force | Age 25-29 |
| Vietnamese | 0.0 /100 | #301 | Tragic 82.8% |
| Immigrants | Belize | 0.0 /100 | #302 | Tragic 82.8% |
| Immigrants | Grenada | 0.0 /100 | #303 | Tragic 82.8% |
| Immigrants | St. Vincent and the Grenadines | 0.0 /100 | #304 | Tragic 82.7% |
| Blacks/African Americans | 0.0 /100 | #305 | Tragic 82.6% |
| Blackfeet | 0.0 /100 | #306 | Tragic 82.6% |
| Cajuns | 0.0 /100 | #307 | Tragic 82.5% |
| Central American Indians | 0.0 /100 | #308 | Tragic 82.4% |
| Immigrants | Central America | 0.0 /100 | #309 | Tragic 82.4% |
| Osage | 0.0 /100 | #310 | Tragic 82.3% |
| Alaskan Athabascans | 0.0 /100 | #311 | Tragic 82.3% |
| Hispanics or Latinos | 0.0 /100 | #312 | Tragic 82.2% |
| Yaqui | 0.0 /100 | #313 | Tragic 82.2% |
| Cherokee | 0.0 /100 | #314 | Tragic 82.1% |
| Immigrants | Mexico | 0.0 /100 | #315 | Tragic 82.0% |