Iranian vs Costa Rican In Labor Force | Age 25-29
COMPARE
Iranian
Costa Rican
In Labor Force | Age 25-29
In Labor Force | Age 25-29 Comparison
Iranians
Costa Ricans
84.8%
IN LABOR FORCE | AGE 25-29
78.1/ 100
METRIC RATING
131st/ 347
METRIC RANK
85.0%
IN LABOR FORCE | AGE 25-29
91.9/ 100
METRIC RATING
109th/ 347
METRIC RANK
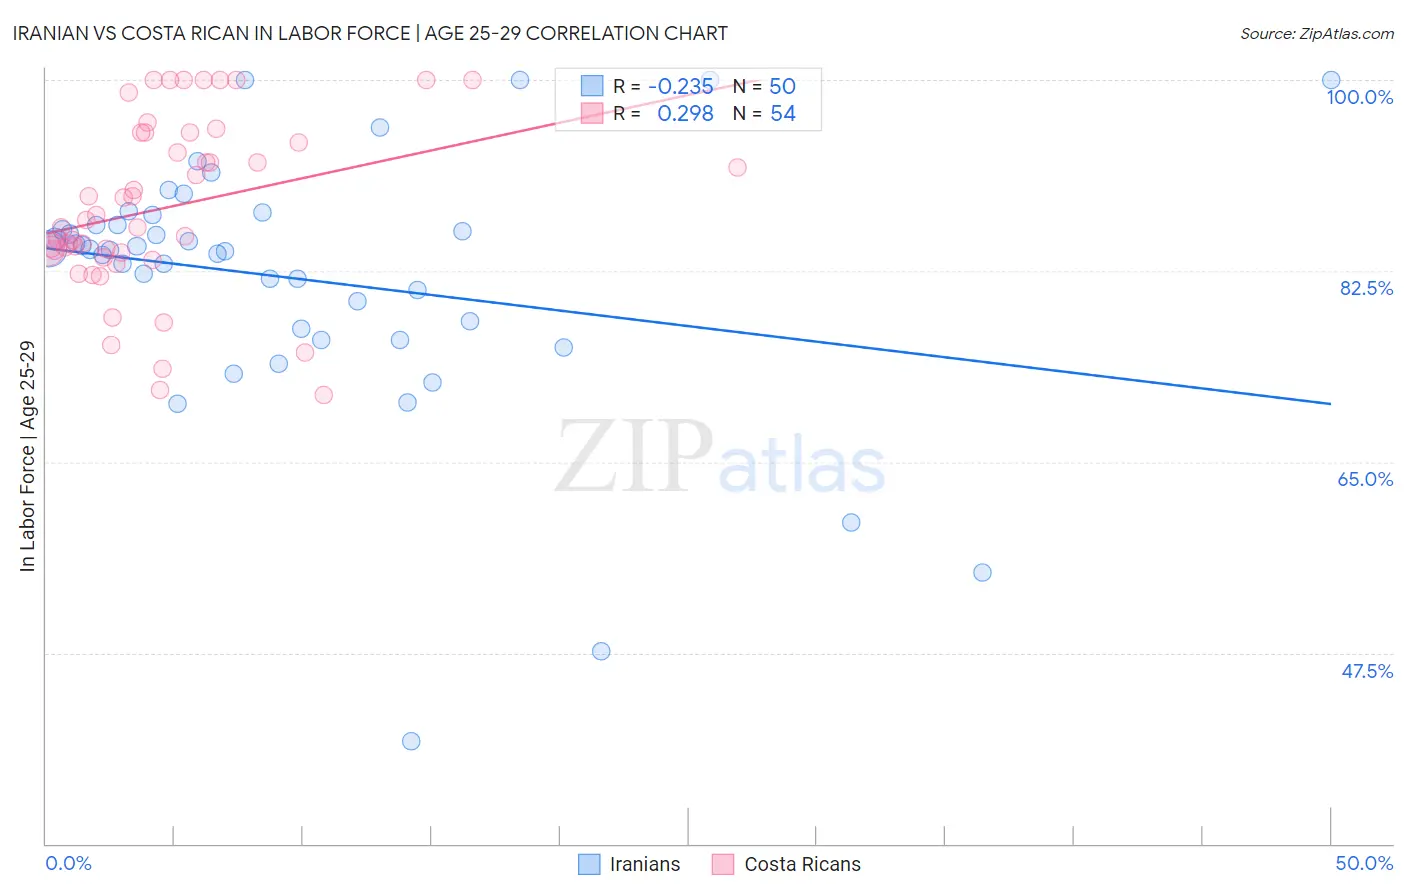
Iranian vs Costa Rican In Labor Force | Age 25-29 Correlation Chart
The statistical analysis conducted on geographies consisting of 316,808,668 people shows a weak negative correlation between the proportion of Iranians and labor force participation rate among population between the ages 25 and 29 in the United States with a correlation coefficient (R) of -0.235 and weighted average of 84.8%. Similarly, the statistical analysis conducted on geographies consisting of 253,578,861 people shows a weak positive correlation between the proportion of Costa Ricans and labor force participation rate among population between the ages 25 and 29 in the United States with a correlation coefficient (R) of 0.298 and weighted average of 85.0%, a difference of 0.21%.
In Labor Force | Age 25-29 Correlation Summary
| Measurement | Iranian | Costa Rican |
| Minimum | 39.4% | 71.1% |
| Maximum | 100.0% | 100.0% |
| Range | 60.6% | 28.9% |
| Mean | 81.8% | 88.3% |
| Median | 84.5% | 86.9% |
| Interquartile 25% (IQ1) | 77.2% | 84.2% |
| Interquartile 75% (IQ3) | 86.7% | 95.2% |
| Interquartile Range (IQR) | 9.6% | 11.0% |
| Standard Deviation (Sample) | 11.9% | 7.9% |
| Standard Deviation (Population) | 11.8% | 7.8% |
Similar Demographics by In Labor Force | Age 25-29
Demographics Similar to Iranians by In Labor Force | Age 25-29
In terms of in labor force | age 25-29, the demographic groups most similar to Iranians are Romanian (84.8%, a difference of 0.0%), Asian (84.8%, a difference of 0.0%), Syrian (84.8%, a difference of 0.020%), Immigrants from Hungary (84.8%, a difference of 0.020%), and Bhutanese (84.8%, a difference of 0.020%).
| Demographics | Rating | Rank | In Labor Force | Age 25-29 |
| Immigrants | Iran | 84.8 /100 | #124 | Excellent 84.9% |
| Uruguayans | 84.7 /100 | #125 | Excellent 84.9% |
| Immigrants | Singapore | 84.4 /100 | #126 | Excellent 84.9% |
| Immigrants | Uruguay | 84.0 /100 | #127 | Excellent 84.9% |
| Australians | 83.6 /100 | #128 | Excellent 84.9% |
| Immigrants | Russia | 81.6 /100 | #129 | Excellent 84.9% |
| Northern Europeans | 81.3 /100 | #130 | Excellent 84.9% |
| Iranians | 78.1 /100 | #131 | Good 84.8% |
| Romanians | 77.7 /100 | #132 | Good 84.8% |
| Asians | 77.7 /100 | #133 | Good 84.8% |
| Syrians | 76.5 /100 | #134 | Good 84.8% |
| Immigrants | Hungary | 76.4 /100 | #135 | Good 84.8% |
| Bhutanese | 76.0 /100 | #136 | Good 84.8% |
| Immigrants | Canada | 73.5 /100 | #137 | Good 84.8% |
| Armenians | 72.7 /100 | #138 | Good 84.8% |
Demographics Similar to Costa Ricans by In Labor Force | Age 25-29
In terms of in labor force | age 25-29, the demographic groups most similar to Costa Ricans are Immigrants from Austria (85.0%, a difference of 0.0%), Immigrants from Southern Europe (85.0%, a difference of 0.010%), New Zealander (85.0%, a difference of 0.010%), Immigrants from Middle Africa (85.0%, a difference of 0.010%), and Immigrants from Hong Kong (85.0%, a difference of 0.020%).
| Demographics | Rating | Rank | In Labor Force | Age 25-29 |
| Slavs | 93.7 /100 | #102 | Exceptional 85.1% |
| Immigrants | Japan | 93.5 /100 | #103 | Exceptional 85.1% |
| Immigrants | Zaire | 93.3 /100 | #104 | Exceptional 85.1% |
| Immigrants | Hong Kong | 92.8 /100 | #105 | Exceptional 85.0% |
| Czechoslovakians | 92.6 /100 | #106 | Exceptional 85.0% |
| Immigrants | Southern Europe | 92.3 /100 | #107 | Exceptional 85.0% |
| Immigrants | Austria | 91.9 /100 | #108 | Exceptional 85.0% |
| Costa Ricans | 91.9 /100 | #109 | Exceptional 85.0% |
| New Zealanders | 91.5 /100 | #110 | Exceptional 85.0% |
| Immigrants | Middle Africa | 91.4 /100 | #111 | Exceptional 85.0% |
| Senegalese | 90.9 /100 | #112 | Exceptional 85.0% |
| Irish | 90.6 /100 | #113 | Exceptional 85.0% |
| Immigrants | Malaysia | 90.4 /100 | #114 | Exceptional 85.0% |
| South Africans | 88.9 /100 | #115 | Excellent 85.0% |
| Chileans | 88.8 /100 | #116 | Excellent 85.0% |