Guamanian/Chamorro vs Central American Indian In Labor Force | Age 25-29
COMPARE
Guamanian/Chamorro
Central American Indian
In Labor Force | Age 25-29
In Labor Force | Age 25-29 Comparison
Guamanians/Chamorros
Central American Indians
83.9%
IN LABOR FORCE | AGE 25-29
0.9/ 100
METRIC RATING
236th/ 347
METRIC RANK
82.4%
IN LABOR FORCE | AGE 25-29
0.0/ 100
METRIC RATING
308th/ 347
METRIC RANK
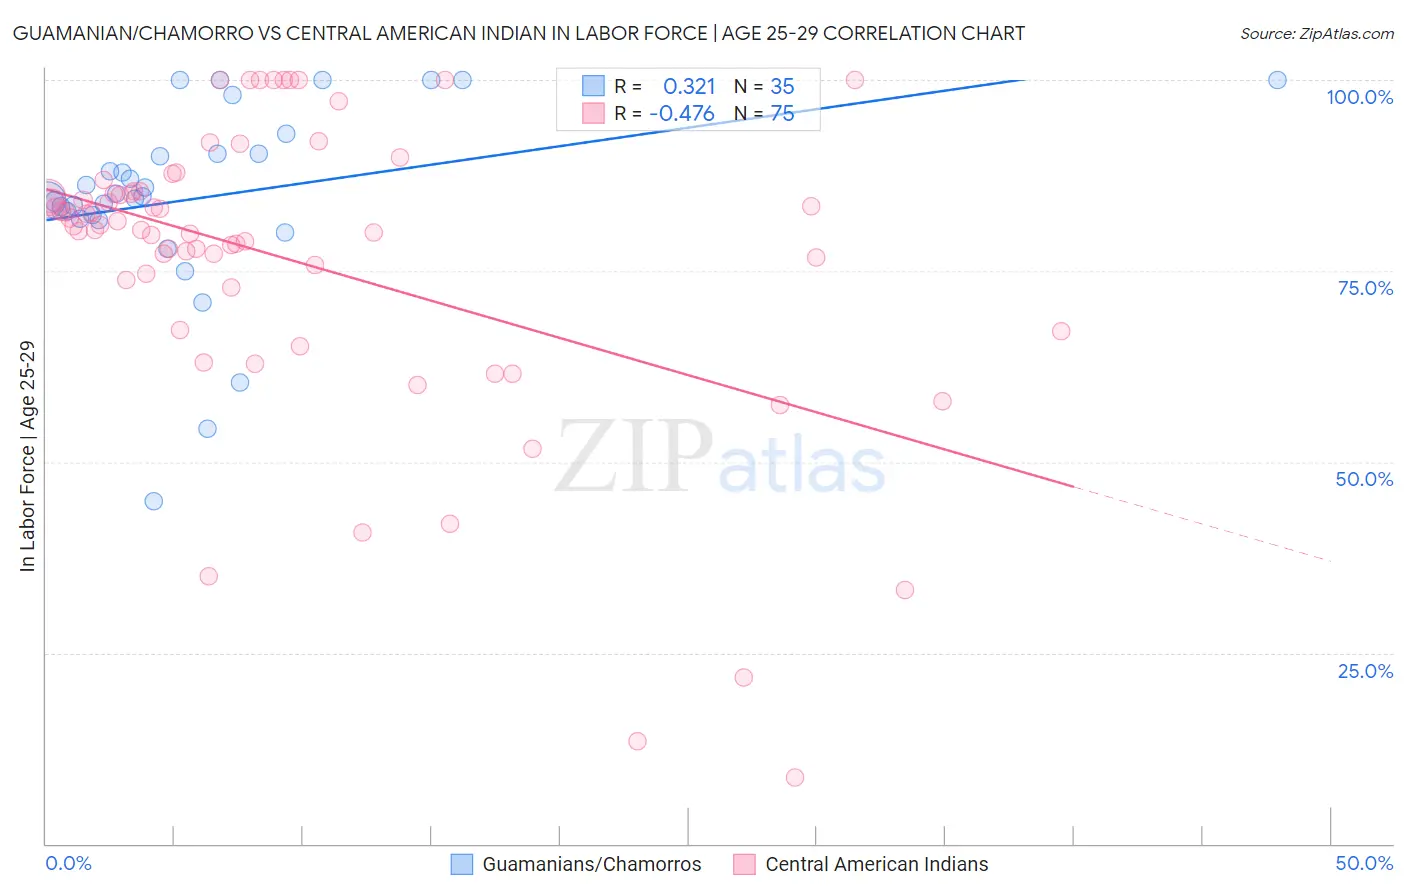
Guamanian/Chamorro vs Central American Indian In Labor Force | Age 25-29 Correlation Chart
The statistical analysis conducted on geographies consisting of 221,933,719 people shows a mild positive correlation between the proportion of Guamanians/Chamorros and labor force participation rate among population between the ages 25 and 29 in the United States with a correlation coefficient (R) of 0.321 and weighted average of 83.9%. Similarly, the statistical analysis conducted on geographies consisting of 326,098,631 people shows a moderate negative correlation between the proportion of Central American Indians and labor force participation rate among population between the ages 25 and 29 in the United States with a correlation coefficient (R) of -0.476 and weighted average of 82.4%, a difference of 1.8%.
In Labor Force | Age 25-29 Correlation Summary
| Measurement | Guamanian/Chamorro | Central American Indian |
| Minimum | 44.9% | 8.6% |
| Maximum | 100.0% | 100.0% |
| Range | 55.1% | 91.4% |
| Mean | 84.6% | 76.3% |
| Median | 84.8% | 80.9% |
| Interquartile 25% (IQ1) | 81.8% | 72.9% |
| Interquartile 75% (IQ3) | 90.3% | 85.4% |
| Interquartile Range (IQR) | 8.6% | 12.5% |
| Standard Deviation (Sample) | 12.4% | 19.5% |
| Standard Deviation (Population) | 12.3% | 19.4% |
Similar Demographics by In Labor Force | Age 25-29
Demographics Similar to Guamanians/Chamorros by In Labor Force | Age 25-29
In terms of in labor force | age 25-29, the demographic groups most similar to Guamanians/Chamorros are Iraqi (83.9%, a difference of 0.0%), Immigrants (83.9%, a difference of 0.0%), Barbadian (83.9%, a difference of 0.020%), Immigrants from Uzbekistan (83.9%, a difference of 0.030%), and Jamaican (83.9%, a difference of 0.040%).
| Demographics | Rating | Rank | In Labor Force | Age 25-29 |
| Immigrants | Oceania | 5.0 /100 | #229 | Tragic 84.2% |
| Whites/Caucasians | 4.8 /100 | #230 | Tragic 84.2% |
| Immigrants | Philippines | 4.7 /100 | #231 | Tragic 84.2% |
| Panamanians | 4.5 /100 | #232 | Tragic 84.2% |
| Immigrants | Western Asia | 2.7 /100 | #233 | Tragic 84.1% |
| Barbadians | 1.0 /100 | #234 | Tragic 83.9% |
| Iraqis | 0.9 /100 | #235 | Tragic 83.9% |
| Guamanians/Chamorros | 0.9 /100 | #236 | Tragic 83.9% |
| Immigrants | Immigrants | 0.9 /100 | #237 | Tragic 83.9% |
| Immigrants | Uzbekistan | 0.8 /100 | #238 | Tragic 83.9% |
| Jamaicans | 0.8 /100 | #239 | Tragic 83.9% |
| Trinidadians and Tobagonians | 0.7 /100 | #240 | Tragic 83.9% |
| Alsatians | 0.7 /100 | #241 | Tragic 83.9% |
| U.S. Virgin Islanders | 0.6 /100 | #242 | Tragic 83.8% |
| Salvadorans | 0.5 /100 | #243 | Tragic 83.8% |
Demographics Similar to Central American Indians by In Labor Force | Age 25-29
In terms of in labor force | age 25-29, the demographic groups most similar to Central American Indians are Immigrants from Central America (82.4%, a difference of 0.010%), Cajun (82.5%, a difference of 0.15%), Osage (82.3%, a difference of 0.15%), Alaskan Athabascan (82.3%, a difference of 0.16%), and Black/African American (82.6%, a difference of 0.21%).
| Demographics | Rating | Rank | In Labor Force | Age 25-29 |
| Vietnamese | 0.0 /100 | #301 | Tragic 82.8% |
| Immigrants | Belize | 0.0 /100 | #302 | Tragic 82.8% |
| Immigrants | Grenada | 0.0 /100 | #303 | Tragic 82.8% |
| Immigrants | St. Vincent and the Grenadines | 0.0 /100 | #304 | Tragic 82.7% |
| Blacks/African Americans | 0.0 /100 | #305 | Tragic 82.6% |
| Blackfeet | 0.0 /100 | #306 | Tragic 82.6% |
| Cajuns | 0.0 /100 | #307 | Tragic 82.5% |
| Central American Indians | 0.0 /100 | #308 | Tragic 82.4% |
| Immigrants | Central America | 0.0 /100 | #309 | Tragic 82.4% |
| Osage | 0.0 /100 | #310 | Tragic 82.3% |
| Alaskan Athabascans | 0.0 /100 | #311 | Tragic 82.3% |
| Hispanics or Latinos | 0.0 /100 | #312 | Tragic 82.2% |
| Yaqui | 0.0 /100 | #313 | Tragic 82.2% |
| Cherokee | 0.0 /100 | #314 | Tragic 82.1% |
| Immigrants | Mexico | 0.0 /100 | #315 | Tragic 82.0% |