Czech vs Central American Indian In Labor Force | Age 25-29
COMPARE
Czech
Central American Indian
In Labor Force | Age 25-29
In Labor Force | Age 25-29 Comparison
Czechs
Central American Indians
85.6%
IN LABOR FORCE | AGE 25-29
99.8/ 100
METRIC RATING
46th/ 347
METRIC RANK
82.4%
IN LABOR FORCE | AGE 25-29
0.0/ 100
METRIC RATING
308th/ 347
METRIC RANK
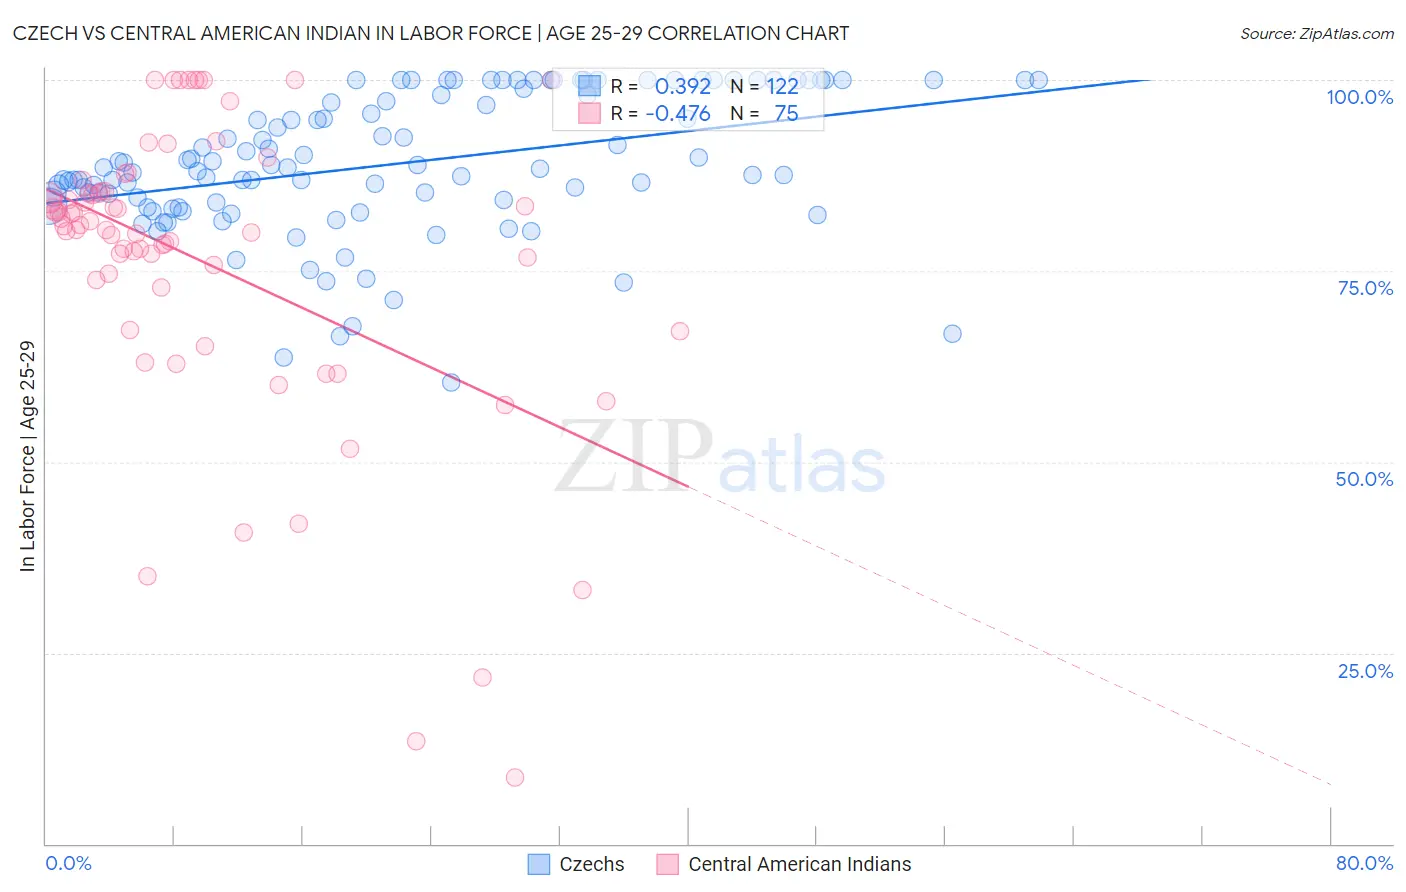
Czech vs Central American Indian In Labor Force | Age 25-29 Correlation Chart
The statistical analysis conducted on geographies consisting of 484,343,470 people shows a mild positive correlation between the proportion of Czechs and labor force participation rate among population between the ages 25 and 29 in the United States with a correlation coefficient (R) of 0.392 and weighted average of 85.6%. Similarly, the statistical analysis conducted on geographies consisting of 326,098,631 people shows a moderate negative correlation between the proportion of Central American Indians and labor force participation rate among population between the ages 25 and 29 in the United States with a correlation coefficient (R) of -0.476 and weighted average of 82.4%, a difference of 3.9%.
In Labor Force | Age 25-29 Correlation Summary
| Measurement | Czech | Central American Indian |
| Minimum | 60.3% | 8.6% |
| Maximum | 100.0% | 100.0% |
| Range | 39.7% | 91.4% |
| Mean | 89.0% | 76.3% |
| Median | 88.5% | 80.9% |
| Interquartile 25% (IQ1) | 83.5% | 72.9% |
| Interquartile 75% (IQ3) | 98.0% | 85.4% |
| Interquartile Range (IQR) | 14.5% | 12.5% |
| Standard Deviation (Sample) | 9.1% | 19.5% |
| Standard Deviation (Population) | 9.0% | 19.4% |
Similar Demographics by In Labor Force | Age 25-29
Demographics Similar to Czechs by In Labor Force | Age 25-29
In terms of in labor force | age 25-29, the demographic groups most similar to Czechs are Turkish (85.6%, a difference of 0.020%), Macedonian (85.7%, a difference of 0.030%), Immigrants from Sierra Leone (85.7%, a difference of 0.030%), Italian (85.6%, a difference of 0.030%), and Immigrants from India (85.7%, a difference of 0.040%).
| Demographics | Rating | Rank | In Labor Force | Age 25-29 |
| Croatians | 99.9 /100 | #39 | Exceptional 85.8% |
| Immigrants | Albania | 99.9 /100 | #40 | Exceptional 85.7% |
| Immigrants | Greece | 99.9 /100 | #41 | Exceptional 85.7% |
| Immigrants | Eritrea | 99.9 /100 | #42 | Exceptional 85.7% |
| Immigrants | India | 99.9 /100 | #43 | Exceptional 85.7% |
| Macedonians | 99.9 /100 | #44 | Exceptional 85.7% |
| Immigrants | Sierra Leone | 99.9 /100 | #45 | Exceptional 85.7% |
| Czechs | 99.8 /100 | #46 | Exceptional 85.6% |
| Turks | 99.8 /100 | #47 | Exceptional 85.6% |
| Italians | 99.8 /100 | #48 | Exceptional 85.6% |
| Swedes | 99.8 /100 | #49 | Exceptional 85.6% |
| Yugoslavians | 99.8 /100 | #50 | Exceptional 85.6% |
| Immigrants | Latvia | 99.8 /100 | #51 | Exceptional 85.6% |
| Immigrants | Poland | 99.7 /100 | #52 | Exceptional 85.6% |
| Belgians | 99.7 /100 | #53 | Exceptional 85.5% |
Demographics Similar to Central American Indians by In Labor Force | Age 25-29
In terms of in labor force | age 25-29, the demographic groups most similar to Central American Indians are Immigrants from Central America (82.4%, a difference of 0.010%), Cajun (82.5%, a difference of 0.15%), Osage (82.3%, a difference of 0.15%), Alaskan Athabascan (82.3%, a difference of 0.16%), and Black/African American (82.6%, a difference of 0.21%).
| Demographics | Rating | Rank | In Labor Force | Age 25-29 |
| Vietnamese | 0.0 /100 | #301 | Tragic 82.8% |
| Immigrants | Belize | 0.0 /100 | #302 | Tragic 82.8% |
| Immigrants | Grenada | 0.0 /100 | #303 | Tragic 82.8% |
| Immigrants | St. Vincent and the Grenadines | 0.0 /100 | #304 | Tragic 82.7% |
| Blacks/African Americans | 0.0 /100 | #305 | Tragic 82.6% |
| Blackfeet | 0.0 /100 | #306 | Tragic 82.6% |
| Cajuns | 0.0 /100 | #307 | Tragic 82.5% |
| Central American Indians | 0.0 /100 | #308 | Tragic 82.4% |
| Immigrants | Central America | 0.0 /100 | #309 | Tragic 82.4% |
| Osage | 0.0 /100 | #310 | Tragic 82.3% |
| Alaskan Athabascans | 0.0 /100 | #311 | Tragic 82.3% |
| Hispanics or Latinos | 0.0 /100 | #312 | Tragic 82.2% |
| Yaqui | 0.0 /100 | #313 | Tragic 82.2% |
| Cherokee | 0.0 /100 | #314 | Tragic 82.1% |
| Immigrants | Mexico | 0.0 /100 | #315 | Tragic 82.0% |