Cypriot vs Osage In Labor Force | Age 35-44
COMPARE
Cypriot
Osage
In Labor Force | Age 35-44
In Labor Force | Age 35-44 Comparison
Cypriots
Osage
85.2%
IN LABOR FORCE | AGE 35-44
99.8/ 100
METRIC RATING
45th/ 347
METRIC RANK
82.9%
IN LABOR FORCE | AGE 35-44
0.0/ 100
METRIC RATING
282nd/ 347
METRIC RANK
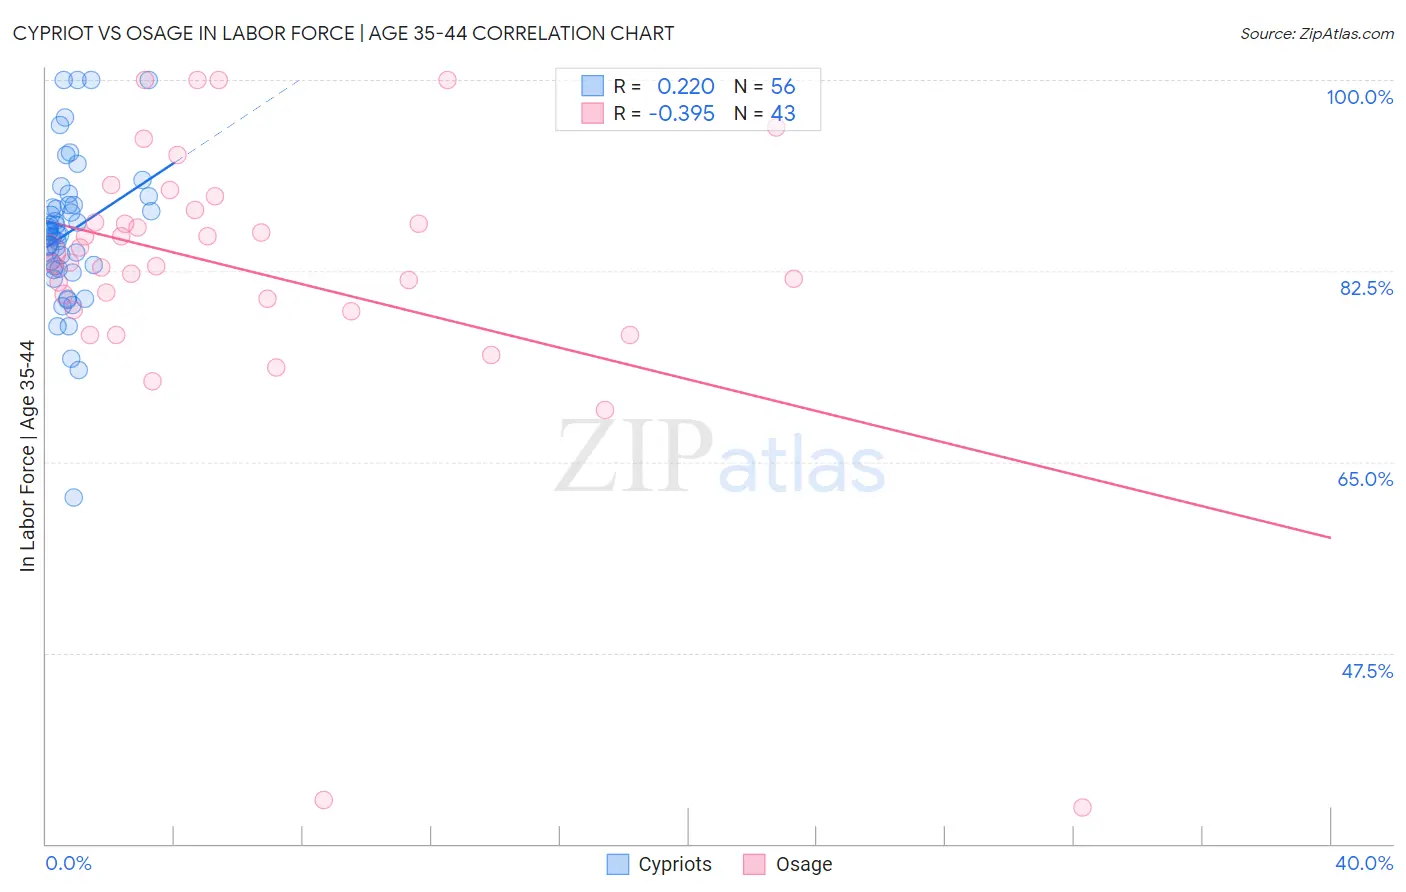
Cypriot vs Osage In Labor Force | Age 35-44 Correlation Chart
The statistical analysis conducted on geographies consisting of 61,851,506 people shows a weak positive correlation between the proportion of Cypriots and labor force participation rate among population between the ages 35 and 44 in the United States with a correlation coefficient (R) of 0.220 and weighted average of 85.2%. Similarly, the statistical analysis conducted on geographies consisting of 91,795,339 people shows a mild negative correlation between the proportion of Osage and labor force participation rate among population between the ages 35 and 44 in the United States with a correlation coefficient (R) of -0.395 and weighted average of 82.9%, a difference of 2.7%.
In Labor Force | Age 35-44 Correlation Summary
| Measurement | Cypriot | Osage |
| Minimum | 61.7% | 33.3% |
| Maximum | 100.0% | 100.0% |
| Range | 38.3% | 66.7% |
| Mean | 86.0% | 82.5% |
| Median | 86.0% | 83.3% |
| Interquartile 25% (IQ1) | 82.8% | 78.9% |
| Interquartile 75% (IQ3) | 88.6% | 88.1% |
| Interquartile Range (IQR) | 5.8% | 9.3% |
| Standard Deviation (Sample) | 6.8% | 13.2% |
| Standard Deviation (Population) | 6.8% | 13.0% |
Similar Demographics by In Labor Force | Age 35-44
Demographics Similar to Cypriots by In Labor Force | Age 35-44
In terms of in labor force | age 35-44, the demographic groups most similar to Cypriots are Immigrants from Hong Kong (85.2%, a difference of 0.0%), Lithuanian (85.2%, a difference of 0.010%), German Russian (85.2%, a difference of 0.010%), Immigrants from Zimbabwe (85.2%, a difference of 0.020%), and Macedonian (85.2%, a difference of 0.020%).
| Demographics | Rating | Rank | In Labor Force | Age 35-44 |
| Immigrants | Poland | 99.8 /100 | #38 | Exceptional 85.2% |
| Eastern Europeans | 99.8 /100 | #39 | Exceptional 85.2% |
| Immigrants | Bulgaria | 99.8 /100 | #40 | Exceptional 85.2% |
| Immigrants | Zimbabwe | 99.8 /100 | #41 | Exceptional 85.2% |
| Macedonians | 99.8 /100 | #42 | Exceptional 85.2% |
| Poles | 99.8 /100 | #43 | Exceptional 85.2% |
| Lithuanians | 99.8 /100 | #44 | Exceptional 85.2% |
| Cypriots | 99.8 /100 | #45 | Exceptional 85.2% |
| Immigrants | Hong Kong | 99.8 /100 | #46 | Exceptional 85.2% |
| German Russians | 99.8 /100 | #47 | Exceptional 85.2% |
| Immigrants | Eritrea | 99.7 /100 | #48 | Exceptional 85.2% |
| Croatians | 99.7 /100 | #49 | Exceptional 85.2% |
| Thais | 99.7 /100 | #50 | Exceptional 85.2% |
| Immigrants | Albania | 99.7 /100 | #51 | Exceptional 85.1% |
| Immigrants | Kenya | 99.6 /100 | #52 | Exceptional 85.1% |
Demographics Similar to Osage by In Labor Force | Age 35-44
In terms of in labor force | age 35-44, the demographic groups most similar to Osage are Immigrants from Guatemala (82.9%, a difference of 0.0%), Immigrants from Dominican Republic (82.9%, a difference of 0.010%), Fijian (82.9%, a difference of 0.020%), Immigrants from Bangladesh (82.9%, a difference of 0.020%), and Immigrants from Belize (82.9%, a difference of 0.030%).
| Demographics | Rating | Rank | In Labor Force | Age 35-44 |
| Hawaiians | 0.0 /100 | #275 | Tragic 83.2% |
| Delaware | 0.0 /100 | #276 | Tragic 83.2% |
| Samoans | 0.0 /100 | #277 | Tragic 83.2% |
| Belizeans | 0.0 /100 | #278 | Tragic 83.1% |
| Immigrants | Micronesia | 0.0 /100 | #279 | Tragic 83.1% |
| Dominicans | 0.0 /100 | #280 | Tragic 83.1% |
| Guatemalans | 0.0 /100 | #281 | Tragic 83.0% |
| Osage | 0.0 /100 | #282 | Tragic 82.9% |
| Immigrants | Guatemala | 0.0 /100 | #283 | Tragic 82.9% |
| Immigrants | Dominican Republic | 0.0 /100 | #284 | Tragic 82.9% |
| Fijians | 0.0 /100 | #285 | Tragic 82.9% |
| Immigrants | Bangladesh | 0.0 /100 | #286 | Tragic 82.9% |
| Immigrants | Belize | 0.0 /100 | #287 | Tragic 82.9% |
| Puget Sound Salish | 0.0 /100 | #288 | Tragic 82.9% |
| Chippewa | 0.0 /100 | #289 | Tragic 82.9% |