Immigrants from El Salvador vs Osage In Labor Force | Age 35-44
COMPARE
Immigrants from El Salvador
Osage
In Labor Force | Age 35-44
In Labor Force | Age 35-44 Comparison
Immigrants from El Salvador
Osage
83.5%
IN LABOR FORCE | AGE 35-44
0.2/ 100
METRIC RATING
259th/ 347
METRIC RANK
82.9%
IN LABOR FORCE | AGE 35-44
0.0/ 100
METRIC RATING
282nd/ 347
METRIC RANK
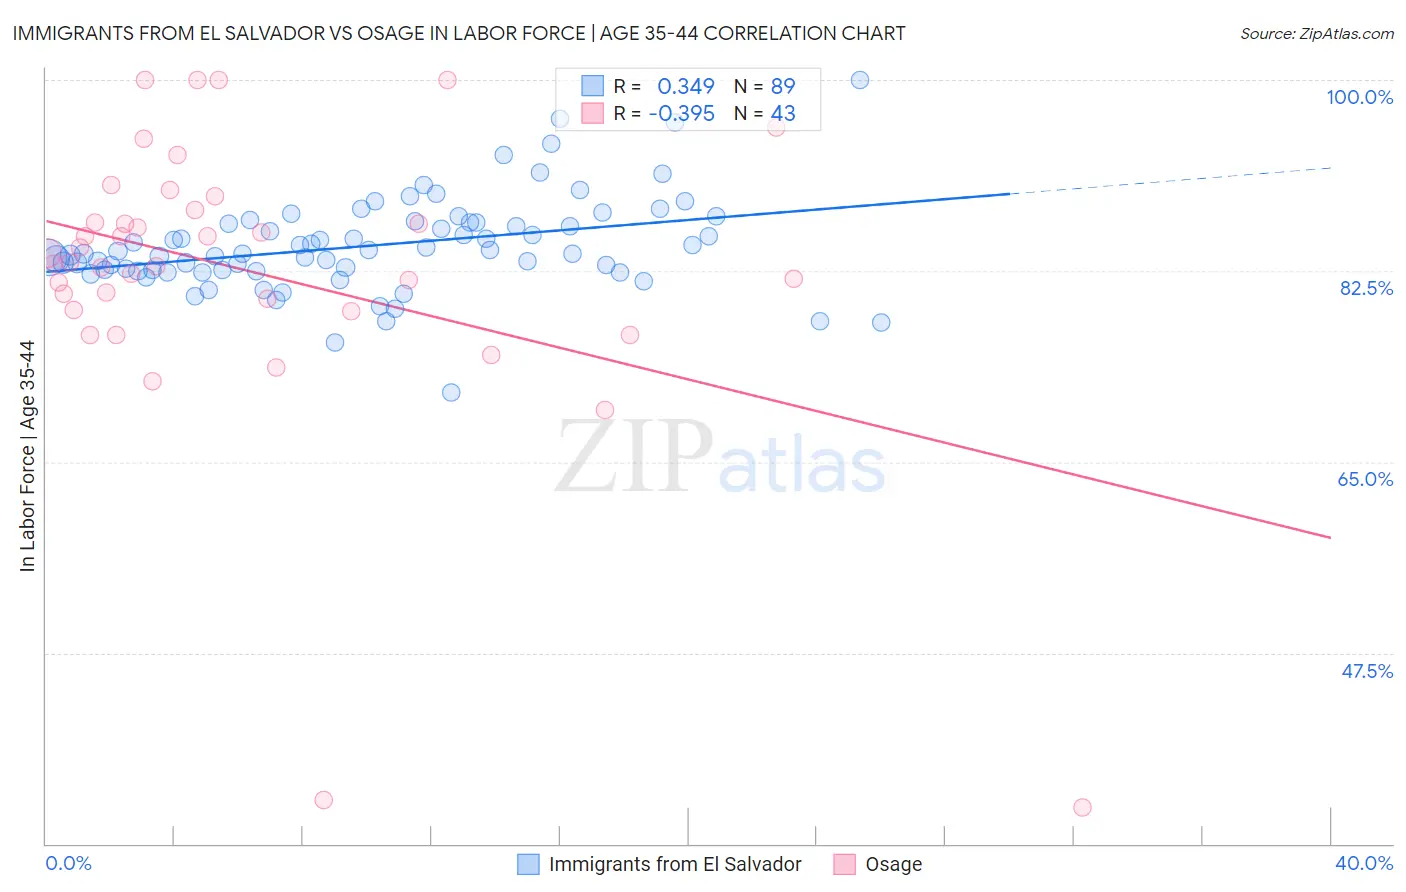
Immigrants from El Salvador vs Osage In Labor Force | Age 35-44 Correlation Chart
The statistical analysis conducted on geographies consisting of 357,718,922 people shows a mild positive correlation between the proportion of Immigrants from El Salvador and labor force participation rate among population between the ages 35 and 44 in the United States with a correlation coefficient (R) of 0.349 and weighted average of 83.5%. Similarly, the statistical analysis conducted on geographies consisting of 91,795,339 people shows a mild negative correlation between the proportion of Osage and labor force participation rate among population between the ages 35 and 44 in the United States with a correlation coefficient (R) of -0.395 and weighted average of 82.9%, a difference of 0.69%.
In Labor Force | Age 35-44 Correlation Summary
| Measurement | Immigrants from El Salvador | Osage |
| Minimum | 71.4% | 33.3% |
| Maximum | 100.0% | 100.0% |
| Range | 28.6% | 66.7% |
| Mean | 84.8% | 82.5% |
| Median | 84.1% | 83.3% |
| Interquartile 25% (IQ1) | 82.5% | 78.9% |
| Interquartile 75% (IQ3) | 86.9% | 88.1% |
| Interquartile Range (IQR) | 4.4% | 9.3% |
| Standard Deviation (Sample) | 4.4% | 13.2% |
| Standard Deviation (Population) | 4.3% | 13.0% |
Similar Demographics by In Labor Force | Age 35-44
Demographics Similar to Immigrants from El Salvador by In Labor Force | Age 35-44
In terms of in labor force | age 35-44, the demographic groups most similar to Immigrants from El Salvador are Vietnamese (83.5%, a difference of 0.010%), Immigrants from Dominica (83.5%, a difference of 0.010%), Tsimshian (83.5%, a difference of 0.020%), Immigrants from Congo (83.5%, a difference of 0.020%), and Basque (83.6%, a difference of 0.050%).
| Demographics | Rating | Rank | In Labor Force | Age 35-44 |
| Immigrants | Guyana | 0.4 /100 | #252 | Tragic 83.6% |
| Lebanese | 0.4 /100 | #253 | Tragic 83.6% |
| Tongans | 0.4 /100 | #254 | Tragic 83.6% |
| Immigrants | Azores | 0.3 /100 | #255 | Tragic 83.6% |
| Japanese | 0.3 /100 | #256 | Tragic 83.6% |
| Basques | 0.3 /100 | #257 | Tragic 83.6% |
| Tsimshian | 0.2 /100 | #258 | Tragic 83.5% |
| Immigrants | El Salvador | 0.2 /100 | #259 | Tragic 83.5% |
| Vietnamese | 0.2 /100 | #260 | Tragic 83.5% |
| Immigrants | Dominica | 0.2 /100 | #261 | Tragic 83.5% |
| Immigrants | Congo | 0.2 /100 | #262 | Tragic 83.5% |
| Iroquois | 0.2 /100 | #263 | Tragic 83.5% |
| Scotch-Irish | 0.1 /100 | #264 | Tragic 83.5% |
| Central Americans | 0.1 /100 | #265 | Tragic 83.5% |
| Spaniards | 0.1 /100 | #266 | Tragic 83.4% |
Demographics Similar to Osage by In Labor Force | Age 35-44
In terms of in labor force | age 35-44, the demographic groups most similar to Osage are Immigrants from Guatemala (82.9%, a difference of 0.0%), Immigrants from Dominican Republic (82.9%, a difference of 0.010%), Fijian (82.9%, a difference of 0.020%), Immigrants from Bangladesh (82.9%, a difference of 0.020%), and Immigrants from Belize (82.9%, a difference of 0.030%).
| Demographics | Rating | Rank | In Labor Force | Age 35-44 |
| Hawaiians | 0.0 /100 | #275 | Tragic 83.2% |
| Delaware | 0.0 /100 | #276 | Tragic 83.2% |
| Samoans | 0.0 /100 | #277 | Tragic 83.2% |
| Belizeans | 0.0 /100 | #278 | Tragic 83.1% |
| Immigrants | Micronesia | 0.0 /100 | #279 | Tragic 83.1% |
| Dominicans | 0.0 /100 | #280 | Tragic 83.1% |
| Guatemalans | 0.0 /100 | #281 | Tragic 83.0% |
| Osage | 0.0 /100 | #282 | Tragic 82.9% |
| Immigrants | Guatemala | 0.0 /100 | #283 | Tragic 82.9% |
| Immigrants | Dominican Republic | 0.0 /100 | #284 | Tragic 82.9% |
| Fijians | 0.0 /100 | #285 | Tragic 82.9% |
| Immigrants | Bangladesh | 0.0 /100 | #286 | Tragic 82.9% |
| Immigrants | Belize | 0.0 /100 | #287 | Tragic 82.9% |
| Puget Sound Salish | 0.0 /100 | #288 | Tragic 82.9% |
| Chippewa | 0.0 /100 | #289 | Tragic 82.9% |