Immigrants from Austria vs Osage In Labor Force | Age 35-44
COMPARE
Immigrants from Austria
Osage
In Labor Force | Age 35-44
In Labor Force | Age 35-44 Comparison
Immigrants from Austria
Osage
84.4%
IN LABOR FORCE | AGE 35-44
63.8/ 100
METRIC RATING
157th/ 347
METRIC RANK
82.9%
IN LABOR FORCE | AGE 35-44
0.0/ 100
METRIC RATING
282nd/ 347
METRIC RANK
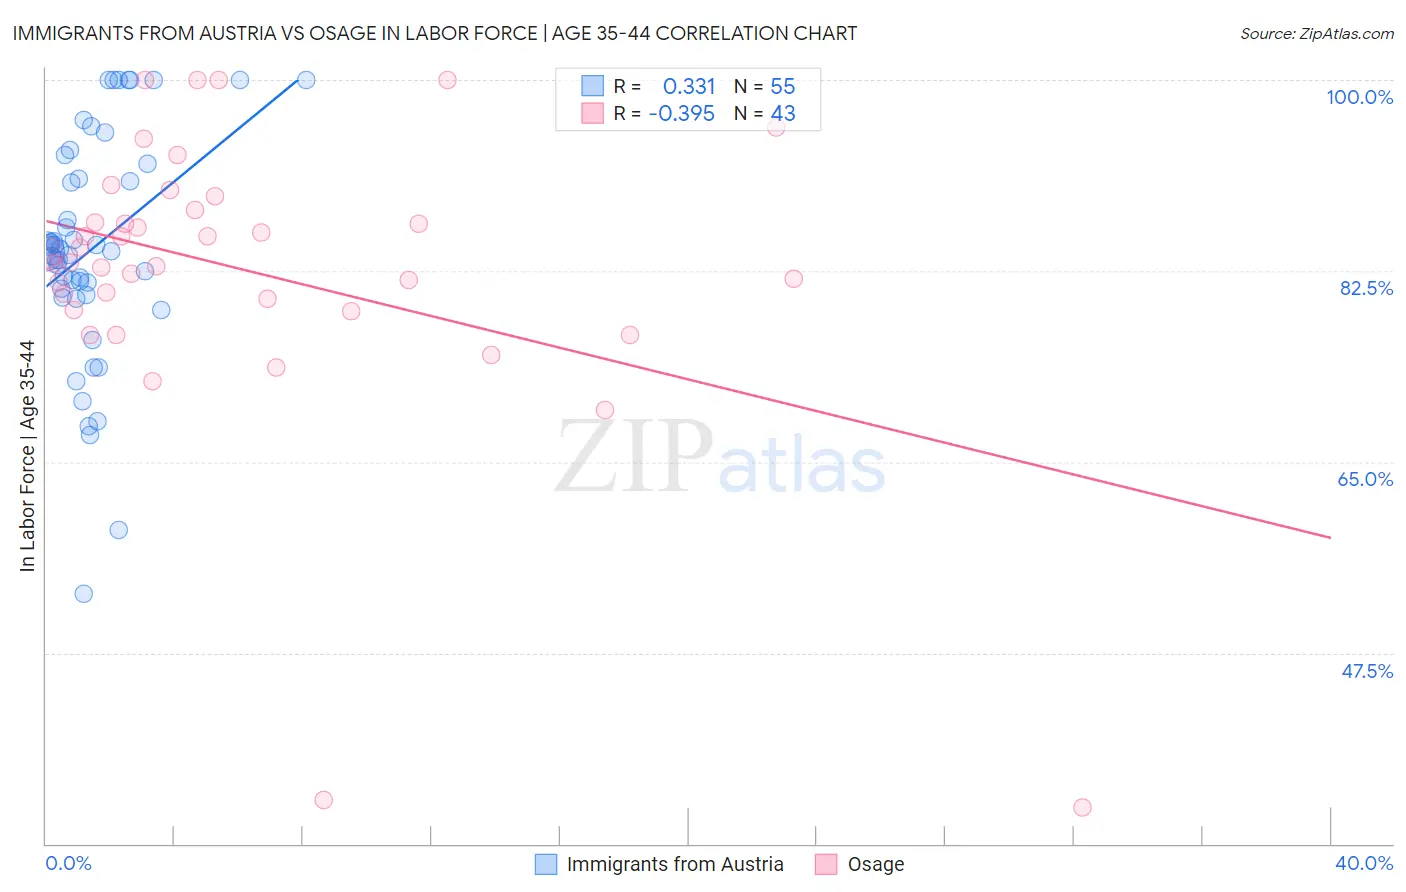
Immigrants from Austria vs Osage In Labor Force | Age 35-44 Correlation Chart
The statistical analysis conducted on geographies consisting of 167,953,357 people shows a mild positive correlation between the proportion of Immigrants from Austria and labor force participation rate among population between the ages 35 and 44 in the United States with a correlation coefficient (R) of 0.331 and weighted average of 84.4%. Similarly, the statistical analysis conducted on geographies consisting of 91,795,339 people shows a mild negative correlation between the proportion of Osage and labor force participation rate among population between the ages 35 and 44 in the United States with a correlation coefficient (R) of -0.395 and weighted average of 82.9%, a difference of 1.8%.
In Labor Force | Age 35-44 Correlation Summary
| Measurement | Immigrants from Austria | Osage |
| Minimum | 52.9% | 33.3% |
| Maximum | 100.0% | 100.0% |
| Range | 47.1% | 66.7% |
| Mean | 84.6% | 82.5% |
| Median | 84.3% | 83.3% |
| Interquartile 25% (IQ1) | 80.3% | 78.9% |
| Interquartile 75% (IQ3) | 92.3% | 88.1% |
| Interquartile Range (IQR) | 12.0% | 9.3% |
| Standard Deviation (Sample) | 10.5% | 13.2% |
| Standard Deviation (Population) | 10.4% | 13.0% |
Similar Demographics by In Labor Force | Age 35-44
Demographics Similar to Immigrants from Austria by In Labor Force | Age 35-44
In terms of in labor force | age 35-44, the demographic groups most similar to Immigrants from Austria are Immigrants from Israel (84.4%, a difference of 0.0%), Immigrants from Switzerland (84.5%, a difference of 0.010%), Jamaican (84.4%, a difference of 0.010%), Immigrants from Senegal (84.4%, a difference of 0.020%), and Immigrants from Kazakhstan (84.4%, a difference of 0.020%).
| Demographics | Rating | Rank | In Labor Force | Age 35-44 |
| Immigrants | Nigeria | 73.3 /100 | #150 | Good 84.5% |
| Romanians | 72.1 /100 | #151 | Good 84.5% |
| Immigrants | Taiwan | 71.4 /100 | #152 | Good 84.5% |
| Trinidadians and Tobagonians | 69.5 /100 | #153 | Good 84.5% |
| Iranians | 69.4 /100 | #154 | Good 84.5% |
| Immigrants | Switzerland | 65.9 /100 | #155 | Good 84.5% |
| Immigrants | Israel | 64.3 /100 | #156 | Good 84.4% |
| Immigrants | Austria | 63.8 /100 | #157 | Good 84.4% |
| Jamaicans | 62.7 /100 | #158 | Good 84.4% |
| Immigrants | Senegal | 60.4 /100 | #159 | Good 84.4% |
| Immigrants | Kazakhstan | 60.4 /100 | #160 | Good 84.4% |
| Immigrants | Venezuela | 60.0 /100 | #161 | Good 84.4% |
| Immigrants | Hungary | 59.4 /100 | #162 | Average 84.4% |
| Aleuts | 59.1 /100 | #163 | Average 84.4% |
| Nigerians | 58.9 /100 | #164 | Average 84.4% |
Demographics Similar to Osage by In Labor Force | Age 35-44
In terms of in labor force | age 35-44, the demographic groups most similar to Osage are Immigrants from Guatemala (82.9%, a difference of 0.0%), Immigrants from Dominican Republic (82.9%, a difference of 0.010%), Fijian (82.9%, a difference of 0.020%), Immigrants from Bangladesh (82.9%, a difference of 0.020%), and Immigrants from Belize (82.9%, a difference of 0.030%).
| Demographics | Rating | Rank | In Labor Force | Age 35-44 |
| Hawaiians | 0.0 /100 | #275 | Tragic 83.2% |
| Delaware | 0.0 /100 | #276 | Tragic 83.2% |
| Samoans | 0.0 /100 | #277 | Tragic 83.2% |
| Belizeans | 0.0 /100 | #278 | Tragic 83.1% |
| Immigrants | Micronesia | 0.0 /100 | #279 | Tragic 83.1% |
| Dominicans | 0.0 /100 | #280 | Tragic 83.1% |
| Guatemalans | 0.0 /100 | #281 | Tragic 83.0% |
| Osage | 0.0 /100 | #282 | Tragic 82.9% |
| Immigrants | Guatemala | 0.0 /100 | #283 | Tragic 82.9% |
| Immigrants | Dominican Republic | 0.0 /100 | #284 | Tragic 82.9% |
| Fijians | 0.0 /100 | #285 | Tragic 82.9% |
| Immigrants | Bangladesh | 0.0 /100 | #286 | Tragic 82.9% |
| Immigrants | Belize | 0.0 /100 | #287 | Tragic 82.9% |
| Puget Sound Salish | 0.0 /100 | #288 | Tragic 82.9% |
| Chippewa | 0.0 /100 | #289 | Tragic 82.9% |