Immigrants from Yemen vs Greek In Labor Force | Age 20-24
COMPARE
Immigrants from Yemen
Greek
In Labor Force | Age 20-24
In Labor Force | Age 20-24 Comparison
Immigrants from Yemen
Greeks
68.9%
IN LABOR FORCE | AGE 20-24
0.0/ 100
METRIC RATING
339th/ 347
METRIC RANK
76.0%
IN LABOR FORCE | AGE 20-24
96.9/ 100
METRIC RATING
107th/ 347
METRIC RANK
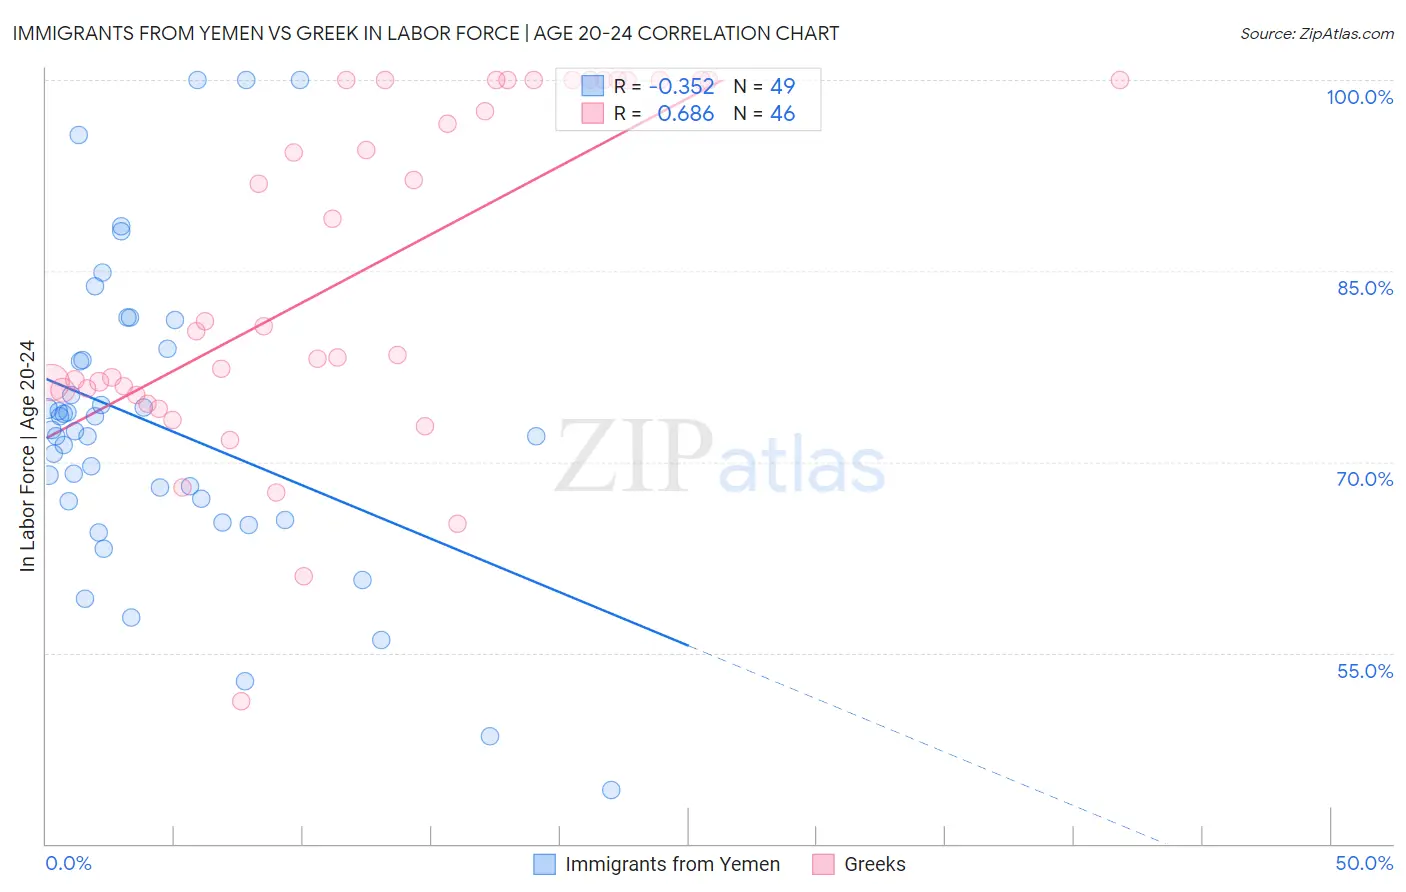
Immigrants from Yemen vs Greek In Labor Force | Age 20-24 Correlation Chart
The statistical analysis conducted on geographies consisting of 82,430,523 people shows a mild negative correlation between the proportion of Immigrants from Yemen and labor force participation rate among population between the ages 20 and 24 in the United States with a correlation coefficient (R) of -0.352 and weighted average of 68.9%. Similarly, the statistical analysis conducted on geographies consisting of 482,371,650 people shows a significant positive correlation between the proportion of Greeks and labor force participation rate among population between the ages 20 and 24 in the United States with a correlation coefficient (R) of 0.686 and weighted average of 76.0%, a difference of 10.3%.
In Labor Force | Age 20-24 Correlation Summary
| Measurement | Immigrants from Yemen | Greek |
| Minimum | 44.2% | 51.2% |
| Maximum | 100.0% | 100.0% |
| Range | 55.8% | 48.8% |
| Mean | 72.9% | 84.7% |
| Median | 72.4% | 80.5% |
| Interquartile 25% (IQ1) | 66.2% | 75.6% |
| Interquartile 75% (IQ3) | 78.4% | 100.0% |
| Interquartile Range (IQR) | 12.3% | 24.4% |
| Standard Deviation (Sample) | 12.0% | 13.4% |
| Standard Deviation (Population) | 11.9% | 13.2% |
Similar Demographics by In Labor Force | Age 20-24
Demographics Similar to Immigrants from Yemen by In Labor Force | Age 20-24
In terms of in labor force | age 20-24, the demographic groups most similar to Immigrants from Yemen are Pima (69.0%, a difference of 0.13%), Menominee (68.7%, a difference of 0.31%), Guyanese (69.2%, a difference of 0.39%), Tohono O'odham (68.6%, a difference of 0.44%), and Immigrants from Guyana (69.3%, a difference of 0.52%).
| Demographics | Rating | Rank | In Labor Force | Age 20-24 |
| Immigrants | Uzbekistan | 0.0 /100 | #332 | Tragic 70.4% |
| Yuman | 0.0 /100 | #333 | Tragic 70.3% |
| British West Indians | 0.0 /100 | #334 | Tragic 70.0% |
| Immigrants | Barbados | 0.0 /100 | #335 | Tragic 69.7% |
| Immigrants | Guyana | 0.0 /100 | #336 | Tragic 69.3% |
| Guyanese | 0.0 /100 | #337 | Tragic 69.2% |
| Pima | 0.0 /100 | #338 | Tragic 69.0% |
| Immigrants | Yemen | 0.0 /100 | #339 | Tragic 68.9% |
| Menominee | 0.0 /100 | #340 | Tragic 68.7% |
| Tohono O'odham | 0.0 /100 | #341 | Tragic 68.6% |
| Immigrants | St. Vincent and the Grenadines | 0.0 /100 | #342 | Tragic 68.4% |
| Puerto Ricans | 0.0 /100 | #343 | Tragic 68.3% |
| Immigrants | Grenada | 0.0 /100 | #344 | Tragic 67.2% |
| Hopi | 0.0 /100 | #345 | Tragic 66.0% |
| Lumbee | 0.0 /100 | #346 | Tragic 65.5% |
Demographics Similar to Greeks by In Labor Force | Age 20-24
In terms of in labor force | age 20-24, the demographic groups most similar to Greeks are Immigrants from Uganda (76.0%, a difference of 0.030%), Iraqi (76.0%, a difference of 0.030%), Macedonian (76.0%, a difference of 0.040%), Immigrants from Nepal (76.0%, a difference of 0.040%), and Immigrants from North Macedonia (76.1%, a difference of 0.080%).
| Demographics | Rating | Rank | In Labor Force | Age 20-24 |
| Shoshone | 97.8 /100 | #100 | Exceptional 76.1% |
| Immigrants | Poland | 97.7 /100 | #101 | Exceptional 76.1% |
| Latvians | 97.6 /100 | #102 | Exceptional 76.1% |
| Immigrants | North Macedonia | 97.5 /100 | #103 | Exceptional 76.1% |
| Macedonians | 97.2 /100 | #104 | Exceptional 76.0% |
| Immigrants | Nepal | 97.2 /100 | #105 | Exceptional 76.0% |
| Immigrants | Uganda | 97.1 /100 | #106 | Exceptional 76.0% |
| Greeks | 96.9 /100 | #107 | Exceptional 76.0% |
| Iraqis | 96.6 /100 | #108 | Exceptional 76.0% |
| Cherokee | 95.8 /100 | #109 | Exceptional 75.9% |
| Immigrants | Morocco | 95.8 /100 | #110 | Exceptional 75.9% |
| Ukrainians | 95.7 /100 | #111 | Exceptional 75.9% |
| Immigrants | Canada | 95.6 /100 | #112 | Exceptional 75.9% |
| Immigrants | Netherlands | 95.3 /100 | #113 | Exceptional 75.9% |
| Immigrants | Zimbabwe | 95.1 /100 | #114 | Exceptional 75.9% |