Immigrants from Yemen vs Okinawan In Labor Force | Age 20-24
COMPARE
Immigrants from Yemen
Okinawan
In Labor Force | Age 20-24
In Labor Force | Age 20-24 Comparison
Immigrants from Yemen
Okinawans
68.9%
IN LABOR FORCE | AGE 20-24
0.0/ 100
METRIC RATING
339th/ 347
METRIC RANK
72.7%
IN LABOR FORCE | AGE 20-24
0.0/ 100
METRIC RATING
295th/ 347
METRIC RANK
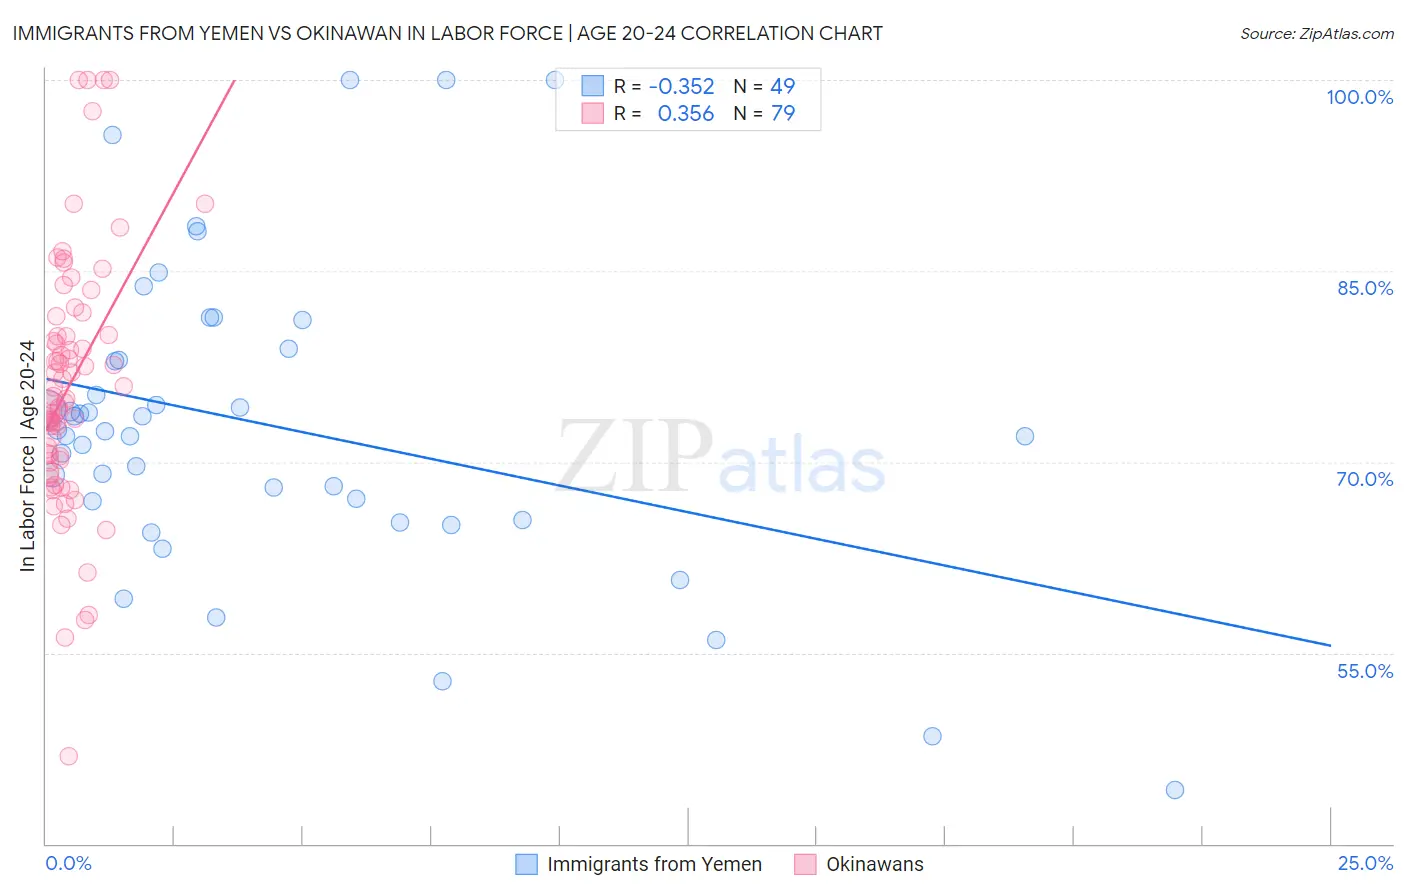
Immigrants from Yemen vs Okinawan In Labor Force | Age 20-24 Correlation Chart
The statistical analysis conducted on geographies consisting of 82,430,523 people shows a mild negative correlation between the proportion of Immigrants from Yemen and labor force participation rate among population between the ages 20 and 24 in the United States with a correlation coefficient (R) of -0.352 and weighted average of 68.9%. Similarly, the statistical analysis conducted on geographies consisting of 73,779,368 people shows a mild positive correlation between the proportion of Okinawans and labor force participation rate among population between the ages 20 and 24 in the United States with a correlation coefficient (R) of 0.356 and weighted average of 72.7%, a difference of 5.5%.
In Labor Force | Age 20-24 Correlation Summary
| Measurement | Immigrants from Yemen | Okinawan |
| Minimum | 44.2% | 46.9% |
| Maximum | 100.0% | 100.0% |
| Range | 55.8% | 53.1% |
| Mean | 72.9% | 76.0% |
| Median | 72.4% | 75.0% |
| Interquartile 25% (IQ1) | 66.2% | 70.2% |
| Interquartile 75% (IQ3) | 78.4% | 80.0% |
| Interquartile Range (IQR) | 12.3% | 9.8% |
| Standard Deviation (Sample) | 12.0% | 9.9% |
| Standard Deviation (Population) | 11.9% | 9.9% |
Similar Demographics by In Labor Force | Age 20-24
Demographics Similar to Immigrants from Yemen by In Labor Force | Age 20-24
In terms of in labor force | age 20-24, the demographic groups most similar to Immigrants from Yemen are Pima (69.0%, a difference of 0.13%), Menominee (68.7%, a difference of 0.31%), Guyanese (69.2%, a difference of 0.39%), Tohono O'odham (68.6%, a difference of 0.44%), and Immigrants from Guyana (69.3%, a difference of 0.52%).
| Demographics | Rating | Rank | In Labor Force | Age 20-24 |
| Immigrants | Uzbekistan | 0.0 /100 | #332 | Tragic 70.4% |
| Yuman | 0.0 /100 | #333 | Tragic 70.3% |
| British West Indians | 0.0 /100 | #334 | Tragic 70.0% |
| Immigrants | Barbados | 0.0 /100 | #335 | Tragic 69.7% |
| Immigrants | Guyana | 0.0 /100 | #336 | Tragic 69.3% |
| Guyanese | 0.0 /100 | #337 | Tragic 69.2% |
| Pima | 0.0 /100 | #338 | Tragic 69.0% |
| Immigrants | Yemen | 0.0 /100 | #339 | Tragic 68.9% |
| Menominee | 0.0 /100 | #340 | Tragic 68.7% |
| Tohono O'odham | 0.0 /100 | #341 | Tragic 68.6% |
| Immigrants | St. Vincent and the Grenadines | 0.0 /100 | #342 | Tragic 68.4% |
| Puerto Ricans | 0.0 /100 | #343 | Tragic 68.3% |
| Immigrants | Grenada | 0.0 /100 | #344 | Tragic 67.2% |
| Hopi | 0.0 /100 | #345 | Tragic 66.0% |
| Lumbee | 0.0 /100 | #346 | Tragic 65.5% |
Demographics Similar to Okinawans by In Labor Force | Age 20-24
In terms of in labor force | age 20-24, the demographic groups most similar to Okinawans are Jamaican (72.7%, a difference of 0.0%), Central American Indian (72.7%, a difference of 0.050%), Immigrants from Argentina (72.8%, a difference of 0.11%), Immigrants from Belize (72.8%, a difference of 0.14%), and Israeli (72.6%, a difference of 0.18%).
| Demographics | Rating | Rank | In Labor Force | Age 20-24 |
| Argentineans | 0.1 /100 | #288 | Tragic 73.1% |
| U.S. Virgin Islanders | 0.1 /100 | #289 | Tragic 73.0% |
| Immigrants | Belarus | 0.1 /100 | #290 | Tragic 73.0% |
| Immigrants | Nicaragua | 0.0 /100 | #291 | Tragic 72.9% |
| Pueblo | 0.0 /100 | #292 | Tragic 72.9% |
| Immigrants | Belize | 0.0 /100 | #293 | Tragic 72.8% |
| Immigrants | Argentina | 0.0 /100 | #294 | Tragic 72.8% |
| Okinawans | 0.0 /100 | #295 | Tragic 72.7% |
| Jamaicans | 0.0 /100 | #296 | Tragic 72.7% |
| Central American Indians | 0.0 /100 | #297 | Tragic 72.7% |
| Israelis | 0.0 /100 | #298 | Tragic 72.6% |
| Iranians | 0.0 /100 | #299 | Tragic 72.6% |
| Armenians | 0.0 /100 | #300 | Tragic 72.5% |
| Cubans | 0.0 /100 | #301 | Tragic 72.5% |
| Natives/Alaskans | 0.0 /100 | #302 | Tragic 72.4% |