Immigrants from Yemen vs Immigrants from Moldova In Labor Force | Age 16-19
COMPARE
Immigrants from Yemen
Immigrants from Moldova
In Labor Force | Age 16-19
In Labor Force | Age 16-19 Comparison
Immigrants from Yemen
Immigrants from Moldova
31.5%
IN LABOR FORCE | AGE 16-19
0.0/ 100
METRIC RATING
318th/ 347
METRIC RANK
37.7%
IN LABOR FORCE | AGE 16-19
91.9/ 100
METRIC RATING
139th/ 347
METRIC RANK
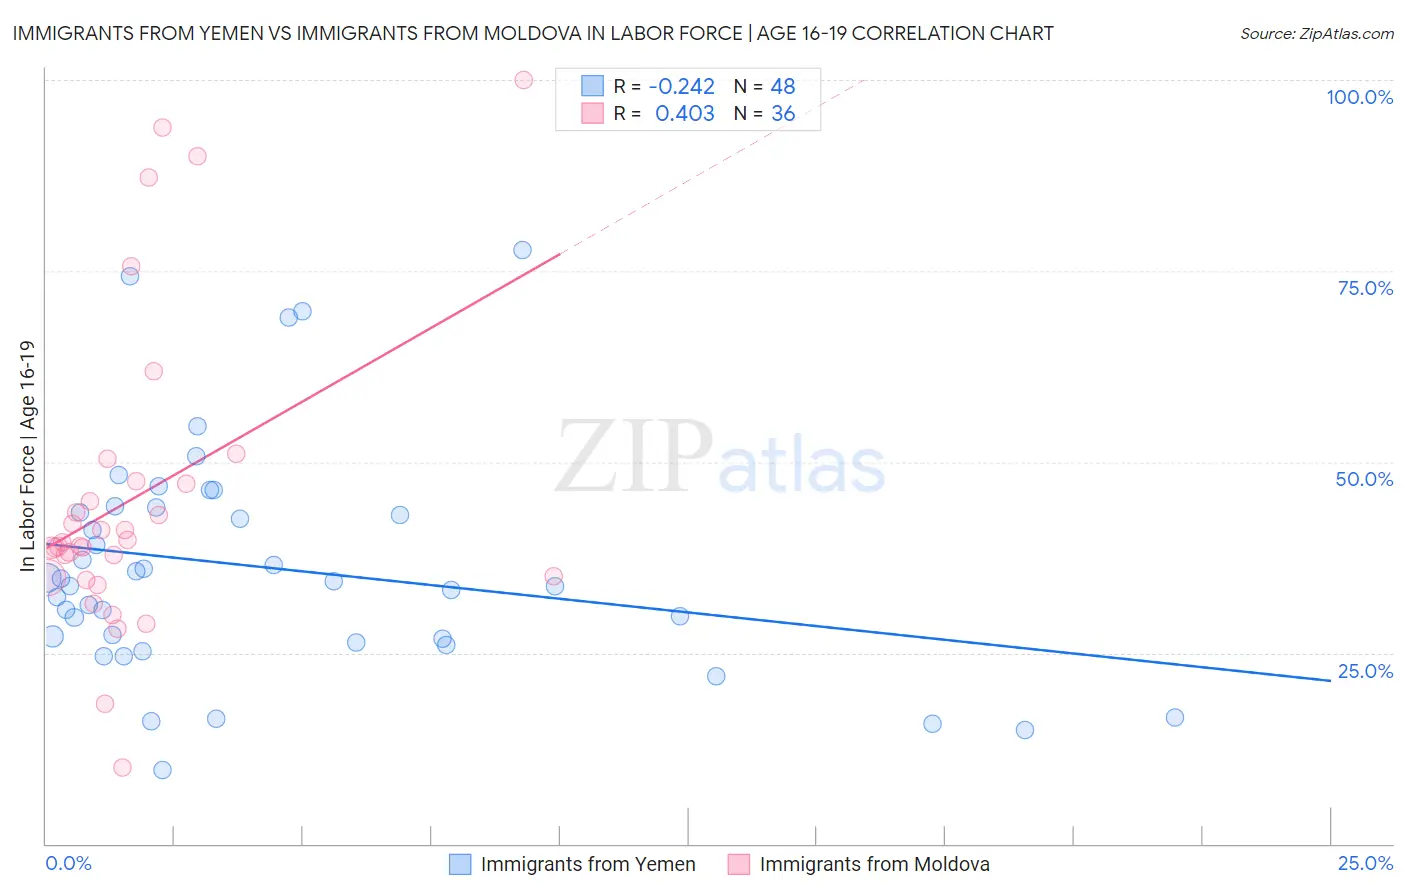
Immigrants from Yemen vs Immigrants from Moldova In Labor Force | Age 16-19 Correlation Chart
The statistical analysis conducted on geographies consisting of 82,404,771 people shows a weak negative correlation between the proportion of Immigrants from Yemen and labor force participation rate among population between the ages 16 and 19 in the United States with a correlation coefficient (R) of -0.242 and weighted average of 31.5%. Similarly, the statistical analysis conducted on geographies consisting of 124,314,308 people shows a moderate positive correlation between the proportion of Immigrants from Moldova and labor force participation rate among population between the ages 16 and 19 in the United States with a correlation coefficient (R) of 0.403 and weighted average of 37.7%, a difference of 19.6%.
In Labor Force | Age 16-19 Correlation Summary
| Measurement | Immigrants from Yemen | Immigrants from Moldova |
| Minimum | 9.6% | 10.0% |
| Maximum | 77.8% | 100.0% |
| Range | 68.2% | 90.0% |
| Mean | 36.1% | 45.3% |
| Median | 34.1% | 39.2% |
| Interquartile 25% (IQ1) | 26.6% | 34.9% |
| Interquartile 75% (IQ3) | 43.7% | 47.3% |
| Interquartile Range (IQR) | 17.0% | 12.4% |
| Standard Deviation (Sample) | 15.1% | 20.2% |
| Standard Deviation (Population) | 14.9% | 19.9% |
Similar Demographics by In Labor Force | Age 16-19
Demographics Similar to Immigrants from Yemen by In Labor Force | Age 16-19
In terms of in labor force | age 16-19, the demographic groups most similar to Immigrants from Yemen are Soviet Union (31.4%, a difference of 0.32%), Immigrants from Nicaragua (31.6%, a difference of 0.34%), Ecuadorian (31.4%, a difference of 0.38%), Filipino (31.7%, a difference of 0.53%), and Immigrants from West Indies (31.7%, a difference of 0.62%).
| Demographics | Rating | Rank | In Labor Force | Age 16-19 |
| Indians (Asian) | 0.0 /100 | #311 | Tragic 31.9% |
| Immigrants | Belize | 0.0 /100 | #312 | Tragic 31.8% |
| Hopi | 0.0 /100 | #313 | Tragic 31.8% |
| Cubans | 0.0 /100 | #314 | Tragic 31.8% |
| Immigrants | West Indies | 0.0 /100 | #315 | Tragic 31.7% |
| Filipinos | 0.0 /100 | #316 | Tragic 31.7% |
| Immigrants | Nicaragua | 0.0 /100 | #317 | Tragic 31.6% |
| Immigrants | Yemen | 0.0 /100 | #318 | Tragic 31.5% |
| Soviet Union | 0.0 /100 | #319 | Tragic 31.4% |
| Ecuadorians | 0.0 /100 | #320 | Tragic 31.4% |
| West Indians | 0.0 /100 | #321 | Tragic 31.3% |
| Tohono O'odham | 0.0 /100 | #322 | Tragic 31.3% |
| Immigrants | Caribbean | 0.0 /100 | #323 | Tragic 31.2% |
| Dominicans | 0.0 /100 | #324 | Tragic 31.2% |
| Immigrants | China | 0.0 /100 | #325 | Tragic 31.1% |
Demographics Similar to Immigrants from Moldova by In Labor Force | Age 16-19
In terms of in labor force | age 16-19, the demographic groups most similar to Immigrants from Moldova are Comanche (37.7%, a difference of 0.010%), Estonian (37.7%, a difference of 0.030%), Syrian (37.6%, a difference of 0.17%), Australian (37.8%, a difference of 0.24%), and Cajun (37.8%, a difference of 0.24%).
| Demographics | Rating | Rank | In Labor Force | Age 16-19 |
| Immigrants | Oceania | 94.7 /100 | #132 | Exceptional 37.9% |
| Cheyenne | 94.6 /100 | #133 | Exceptional 37.9% |
| Immigrants | Netherlands | 93.7 /100 | #134 | Exceptional 37.8% |
| Macedonians | 93.4 /100 | #135 | Exceptional 37.8% |
| Australians | 93.2 /100 | #136 | Exceptional 37.8% |
| Cajuns | 93.2 /100 | #137 | Exceptional 37.8% |
| Comanche | 91.9 /100 | #138 | Exceptional 37.7% |
| Immigrants | Moldova | 91.9 /100 | #139 | Exceptional 37.7% |
| Estonians | 91.7 /100 | #140 | Exceptional 37.7% |
| Syrians | 90.7 /100 | #141 | Exceptional 37.6% |
| Sierra Leoneans | 89.7 /100 | #142 | Excellent 37.6% |
| Pakistanis | 89.5 /100 | #143 | Excellent 37.6% |
| Japanese | 89.3 /100 | #144 | Excellent 37.5% |
| Paiute | 89.3 /100 | #145 | Excellent 37.5% |
| Immigrants | Western Europe | 88.9 /100 | #146 | Excellent 37.5% |