Immigrants from Yemen vs Panamanian In Labor Force | Age 16-19
COMPARE
Immigrants from Yemen
Panamanian
In Labor Force | Age 16-19
In Labor Force | Age 16-19 Comparison
Immigrants from Yemen
Panamanians
31.5%
IN LABOR FORCE | AGE 16-19
0.0/ 100
METRIC RATING
318th/ 347
METRIC RANK
36.1%
IN LABOR FORCE | AGE 16-19
28.6/ 100
METRIC RATING
190th/ 347
METRIC RANK
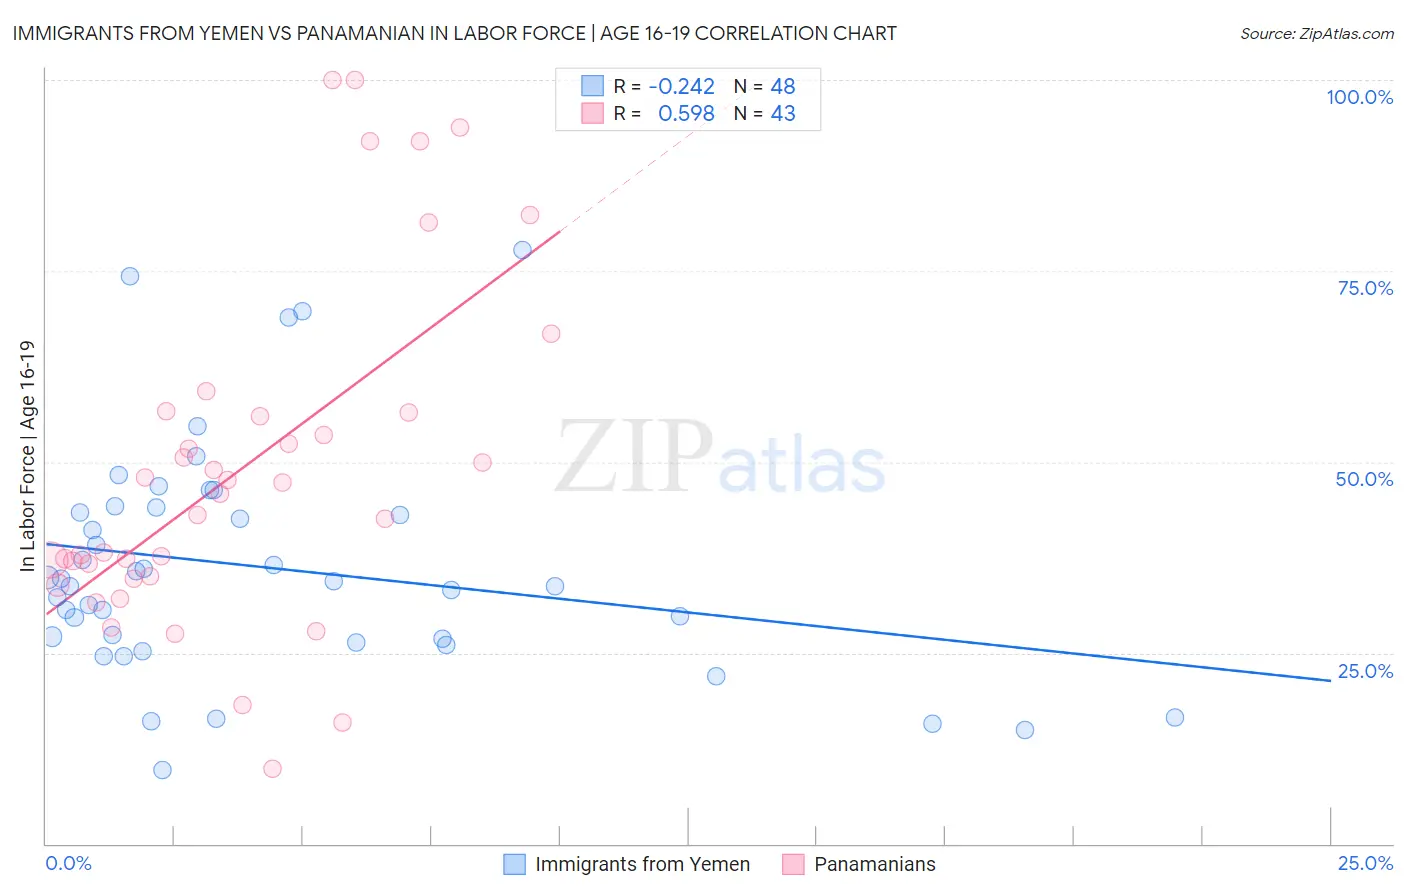
Immigrants from Yemen vs Panamanian In Labor Force | Age 16-19 Correlation Chart
The statistical analysis conducted on geographies consisting of 82,404,771 people shows a weak negative correlation between the proportion of Immigrants from Yemen and labor force participation rate among population between the ages 16 and 19 in the United States with a correlation coefficient (R) of -0.242 and weighted average of 31.5%. Similarly, the statistical analysis conducted on geographies consisting of 281,056,655 people shows a substantial positive correlation between the proportion of Panamanians and labor force participation rate among population between the ages 16 and 19 in the United States with a correlation coefficient (R) of 0.598 and weighted average of 36.1%, a difference of 14.7%.
In Labor Force | Age 16-19 Correlation Summary
| Measurement | Immigrants from Yemen | Panamanian |
| Minimum | 9.6% | 9.9% |
| Maximum | 77.8% | 100.0% |
| Range | 68.2% | 90.1% |
| Mean | 36.1% | 49.1% |
| Median | 34.1% | 45.8% |
| Interquartile 25% (IQ1) | 26.6% | 35.1% |
| Interquartile 75% (IQ3) | 43.7% | 56.4% |
| Interquartile Range (IQR) | 17.0% | 21.3% |
| Standard Deviation (Sample) | 15.1% | 22.4% |
| Standard Deviation (Population) | 14.9% | 22.1% |
Similar Demographics by In Labor Force | Age 16-19
Demographics Similar to Immigrants from Yemen by In Labor Force | Age 16-19
In terms of in labor force | age 16-19, the demographic groups most similar to Immigrants from Yemen are Soviet Union (31.4%, a difference of 0.32%), Immigrants from Nicaragua (31.6%, a difference of 0.34%), Ecuadorian (31.4%, a difference of 0.38%), Filipino (31.7%, a difference of 0.53%), and Immigrants from West Indies (31.7%, a difference of 0.62%).
| Demographics | Rating | Rank | In Labor Force | Age 16-19 |
| Indians (Asian) | 0.0 /100 | #311 | Tragic 31.9% |
| Immigrants | Belize | 0.0 /100 | #312 | Tragic 31.8% |
| Hopi | 0.0 /100 | #313 | Tragic 31.8% |
| Cubans | 0.0 /100 | #314 | Tragic 31.8% |
| Immigrants | West Indies | 0.0 /100 | #315 | Tragic 31.7% |
| Filipinos | 0.0 /100 | #316 | Tragic 31.7% |
| Immigrants | Nicaragua | 0.0 /100 | #317 | Tragic 31.6% |
| Immigrants | Yemen | 0.0 /100 | #318 | Tragic 31.5% |
| Soviet Union | 0.0 /100 | #319 | Tragic 31.4% |
| Ecuadorians | 0.0 /100 | #320 | Tragic 31.4% |
| West Indians | 0.0 /100 | #321 | Tragic 31.3% |
| Tohono O'odham | 0.0 /100 | #322 | Tragic 31.3% |
| Immigrants | Caribbean | 0.0 /100 | #323 | Tragic 31.2% |
| Dominicans | 0.0 /100 | #324 | Tragic 31.2% |
| Immigrants | China | 0.0 /100 | #325 | Tragic 31.1% |
Demographics Similar to Panamanians by In Labor Force | Age 16-19
In terms of in labor force | age 16-19, the demographic groups most similar to Panamanians are Immigrants from Hungary (36.2%, a difference of 0.010%), Immigrants from Croatia (36.1%, a difference of 0.070%), Immigrants from Europe (36.2%, a difference of 0.19%), Afghan (36.1%, a difference of 0.19%), and Immigrants from Denmark (36.1%, a difference of 0.23%).
| Demographics | Rating | Rank | In Labor Force | Age 16-19 |
| Eastern Europeans | 38.8 /100 | #183 | Fair 36.4% |
| Costa Ricans | 36.1 /100 | #184 | Fair 36.3% |
| Bhutanese | 35.3 /100 | #185 | Fair 36.3% |
| Immigrants | Romania | 34.0 /100 | #186 | Fair 36.3% |
| Immigrants | Afghanistan | 34.0 /100 | #187 | Fair 36.3% |
| Immigrants | Europe | 31.8 /100 | #188 | Fair 36.2% |
| Immigrants | Hungary | 28.8 /100 | #189 | Fair 36.2% |
| Panamanians | 28.6 /100 | #190 | Fair 36.1% |
| Immigrants | Croatia | 27.5 /100 | #191 | Fair 36.1% |
| Afghans | 25.7 /100 | #192 | Fair 36.1% |
| Immigrants | Denmark | 25.0 /100 | #193 | Fair 36.1% |
| Nigerians | 24.6 /100 | #194 | Fair 36.1% |
| Bolivians | 23.3 /100 | #195 | Fair 36.0% |
| Mexican American Indians | 21.1 /100 | #196 | Fair 36.0% |
| Immigrants | Serbia | 21.0 /100 | #197 | Fair 36.0% |