Immigrants from Western Europe vs Immigrants from Sudan In Labor Force | Age > 16
COMPARE
Immigrants from Western Europe
Immigrants from Sudan
In Labor Force | Age > 16
In Labor Force | Age > 16 Comparison
Immigrants from Western Europe
Immigrants from Sudan
64.2%
IN LABOR FORCE | AGE > 16
0.7/ 100
METRIC RATING
259th/ 347
METRIC RANK
67.7%
IN LABOR FORCE | AGE > 16
100.0/ 100
METRIC RATING
16th/ 347
METRIC RANK
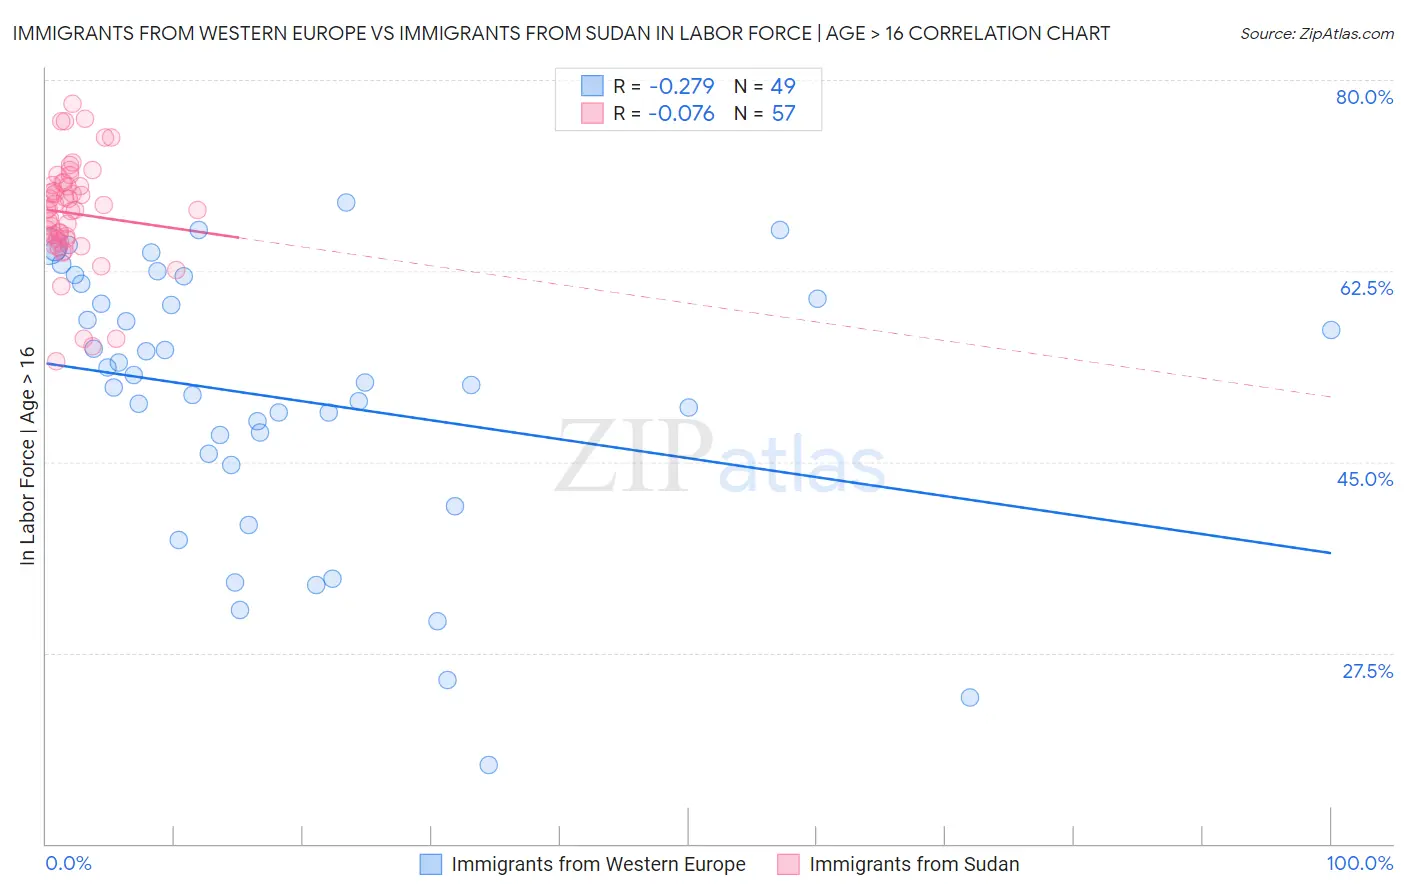
Immigrants from Western Europe vs Immigrants from Sudan In Labor Force | Age > 16 Correlation Chart
The statistical analysis conducted on geographies consisting of 494,084,612 people shows a weak negative correlation between the proportion of Immigrants from Western Europe and labor force participation rate among population ages 16 and over in the United States with a correlation coefficient (R) of -0.279 and weighted average of 64.2%. Similarly, the statistical analysis conducted on geographies consisting of 118,970,540 people shows a slight negative correlation between the proportion of Immigrants from Sudan and labor force participation rate among population ages 16 and over in the United States with a correlation coefficient (R) of -0.076 and weighted average of 67.7%, a difference of 5.4%.
In Labor Force | Age > 16 Correlation Summary
| Measurement | Immigrants from Western Europe | Immigrants from Sudan |
| Minimum | 17.2% | 54.3% |
| Maximum | 68.8% | 77.9% |
| Range | 51.6% | 23.6% |
| Mean | 50.8% | 67.8% |
| Median | 52.2% | 68.1% |
| Interquartile 25% (IQ1) | 45.2% | 65.4% |
| Interquartile 75% (IQ3) | 60.6% | 70.5% |
| Interquartile Range (IQR) | 15.4% | 5.1% |
| Standard Deviation (Sample) | 12.4% | 4.9% |
| Standard Deviation (Population) | 12.2% | 4.9% |
Similar Demographics by In Labor Force | Age > 16
Demographics Similar to Immigrants from Western Europe by In Labor Force | Age > 16
In terms of in labor force | age > 16, the demographic groups most similar to Immigrants from Western Europe are Marshallese (64.2%, a difference of 0.010%), Basque (64.2%, a difference of 0.010%), Finnish (64.2%, a difference of 0.020%), Immigrants from Scotland (64.2%, a difference of 0.030%), and Bahamian (64.2%, a difference of 0.040%).
| Demographics | Rating | Rank | In Labor Force | Age > 16 |
| Immigrants | Dominican Republic | 1.5 /100 | #252 | Tragic 64.4% |
| Czechoslovakians | 1.4 /100 | #253 | Tragic 64.3% |
| Immigrants | Uzbekistan | 1.4 /100 | #254 | Tragic 64.3% |
| Hispanics or Latinos | 1.1 /100 | #255 | Tragic 64.3% |
| Immigrants | Mexico | 1.0 /100 | #256 | Tragic 64.3% |
| Inupiat | 0.8 /100 | #257 | Tragic 64.3% |
| Immigrants | Scotland | 0.8 /100 | #258 | Tragic 64.2% |
| Immigrants | Western Europe | 0.7 /100 | #259 | Tragic 64.2% |
| Marshallese | 0.7 /100 | #260 | Tragic 64.2% |
| Basques | 0.7 /100 | #261 | Tragic 64.2% |
| Finns | 0.7 /100 | #262 | Tragic 64.2% |
| Bahamians | 0.6 /100 | #263 | Tragic 64.2% |
| Dutch | 0.6 /100 | #264 | Tragic 64.2% |
| Cubans | 0.5 /100 | #265 | Tragic 64.2% |
| Immigrants | England | 0.5 /100 | #266 | Tragic 64.2% |
Demographics Similar to Immigrants from Sudan by In Labor Force | Age > 16
In terms of in labor force | age > 16, the demographic groups most similar to Immigrants from Sudan are Immigrants from India (67.6%, a difference of 0.070%), Immigrants from Liberia (67.6%, a difference of 0.090%), Immigrants from Middle Africa (67.7%, a difference of 0.11%), Kenyan (67.6%, a difference of 0.13%), and Liberian (67.8%, a difference of 0.16%).
| Demographics | Rating | Rank | In Labor Force | Age > 16 |
| Immigrants | Eastern Africa | 100.0 /100 | #9 | Exceptional 68.5% |
| Immigrants | Bolivia | 100.0 /100 | #10 | Exceptional 68.4% |
| Bolivians | 100.0 /100 | #11 | Exceptional 68.2% |
| Sudanese | 100.0 /100 | #12 | Exceptional 68.0% |
| Immigrants | Nepal | 100.0 /100 | #13 | Exceptional 68.0% |
| Liberians | 100.0 /100 | #14 | Exceptional 67.8% |
| Immigrants | Middle Africa | 100.0 /100 | #15 | Exceptional 67.7% |
| Immigrants | Sudan | 100.0 /100 | #16 | Exceptional 67.7% |
| Immigrants | India | 100.0 /100 | #17 | Exceptional 67.6% |
| Immigrants | Liberia | 100.0 /100 | #18 | Exceptional 67.6% |
| Kenyans | 100.0 /100 | #19 | Exceptional 67.6% |
| Immigrants | Kenya | 100.0 /100 | #20 | Exceptional 67.6% |
| Tongans | 100.0 /100 | #21 | Exceptional 67.5% |
| Immigrants | Uganda | 100.0 /100 | #22 | Exceptional 67.5% |
| Cambodians | 100.0 /100 | #23 | Exceptional 67.4% |