Immigrants from Western Europe vs Dominican In Labor Force | Age > 16
COMPARE
Immigrants from Western Europe
Dominican
In Labor Force | Age > 16
In Labor Force | Age > 16 Comparison
Immigrants from Western Europe
Dominicans
64.2%
IN LABOR FORCE | AGE > 16
0.7/ 100
METRIC RATING
259th/ 347
METRIC RANK
64.1%
IN LABOR FORCE | AGE > 16
0.4/ 100
METRIC RATING
271st/ 347
METRIC RANK
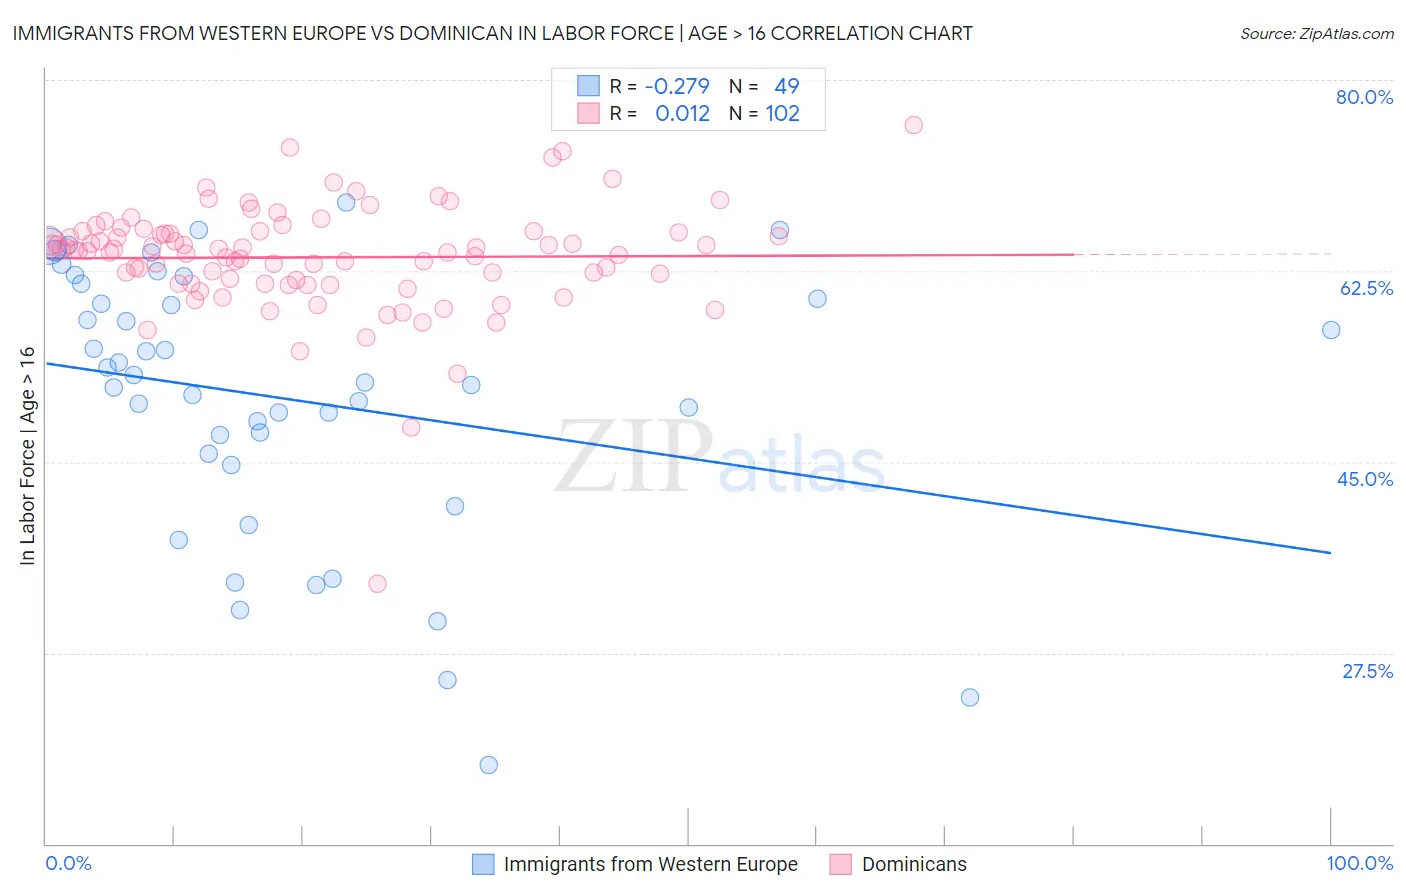
Immigrants from Western Europe vs Dominican In Labor Force | Age > 16 Correlation Chart
The statistical analysis conducted on geographies consisting of 494,084,612 people shows a weak negative correlation between the proportion of Immigrants from Western Europe and labor force participation rate among population ages 16 and over in the United States with a correlation coefficient (R) of -0.279 and weighted average of 64.2%. Similarly, the statistical analysis conducted on geographies consisting of 355,150,180 people shows no correlation between the proportion of Dominicans and labor force participation rate among population ages 16 and over in the United States with a correlation coefficient (R) of 0.012 and weighted average of 64.1%, a difference of 0.19%.
In Labor Force | Age > 16 Correlation Summary
| Measurement | Immigrants from Western Europe | Dominican |
| Minimum | 17.2% | 33.8% |
| Maximum | 68.8% | 75.9% |
| Range | 51.6% | 42.1% |
| Mean | 50.8% | 63.7% |
| Median | 52.2% | 64.4% |
| Interquartile 25% (IQ1) | 45.2% | 61.3% |
| Interquartile 75% (IQ3) | 60.6% | 66.1% |
| Interquartile Range (IQR) | 15.4% | 4.8% |
| Standard Deviation (Sample) | 12.4% | 5.2% |
| Standard Deviation (Population) | 12.2% | 5.2% |
Demographics Similar to Immigrants from Western Europe and Dominicans by In Labor Force | Age > 16
In terms of in labor force | age > 16, the demographic groups most similar to Immigrants from Western Europe are Marshallese (64.2%, a difference of 0.010%), Basque (64.2%, a difference of 0.010%), Finnish (64.2%, a difference of 0.020%), Immigrants from Scotland (64.2%, a difference of 0.030%), and Bahamian (64.2%, a difference of 0.040%). Similarly, the demographic groups most similar to Dominicans are Guyanese (64.1%, a difference of 0.0%), Irish (64.1%, a difference of 0.030%), Native Hawaiian (64.1%, a difference of 0.030%), Hmong (64.1%, a difference of 0.030%), and Immigrants from Cuba (64.1%, a difference of 0.040%).
| Demographics | Rating | Rank | In Labor Force | Age > 16 |
| Hispanics or Latinos | 1.1 /100 | #255 | Tragic 64.3% |
| Immigrants | Mexico | 1.0 /100 | #256 | Tragic 64.3% |
| Inupiat | 0.8 /100 | #257 | Tragic 64.3% |
| Immigrants | Scotland | 0.8 /100 | #258 | Tragic 64.2% |
| Immigrants | Western Europe | 0.7 /100 | #259 | Tragic 64.2% |
| Marshallese | 0.7 /100 | #260 | Tragic 64.2% |
| Basques | 0.7 /100 | #261 | Tragic 64.2% |
| Finns | 0.7 /100 | #262 | Tragic 64.2% |
| Bahamians | 0.6 /100 | #263 | Tragic 64.2% |
| Dutch | 0.6 /100 | #264 | Tragic 64.2% |
| Cubans | 0.5 /100 | #265 | Tragic 64.2% |
| Immigrants | England | 0.5 /100 | #266 | Tragic 64.2% |
| Canadians | 0.5 /100 | #267 | Tragic 64.1% |
| Spaniards | 0.5 /100 | #268 | Tragic 64.1% |
| Irish | 0.4 /100 | #269 | Tragic 64.1% |
| Guyanese | 0.4 /100 | #270 | Tragic 64.1% |
| Dominicans | 0.4 /100 | #271 | Tragic 64.1% |
| Native Hawaiians | 0.3 /100 | #272 | Tragic 64.1% |
| Hmong | 0.3 /100 | #273 | Tragic 64.1% |
| Immigrants | Cuba | 0.3 /100 | #274 | Tragic 64.1% |
| Mexicans | 0.3 /100 | #275 | Tragic 64.1% |