Immigrants from Western Europe vs Carpatho Rusyn In Labor Force | Age > 16
COMPARE
Immigrants from Western Europe
Carpatho Rusyn
In Labor Force | Age > 16
In Labor Force | Age > 16 Comparison
Immigrants from Western Europe
Carpatho Rusyns
64.2%
IN LABOR FORCE | AGE > 16
0.7/ 100
METRIC RATING
259th/ 347
METRIC RANK
65.0%
IN LABOR FORCE | AGE > 16
40.0/ 100
METRIC RATING
184th/ 347
METRIC RANK
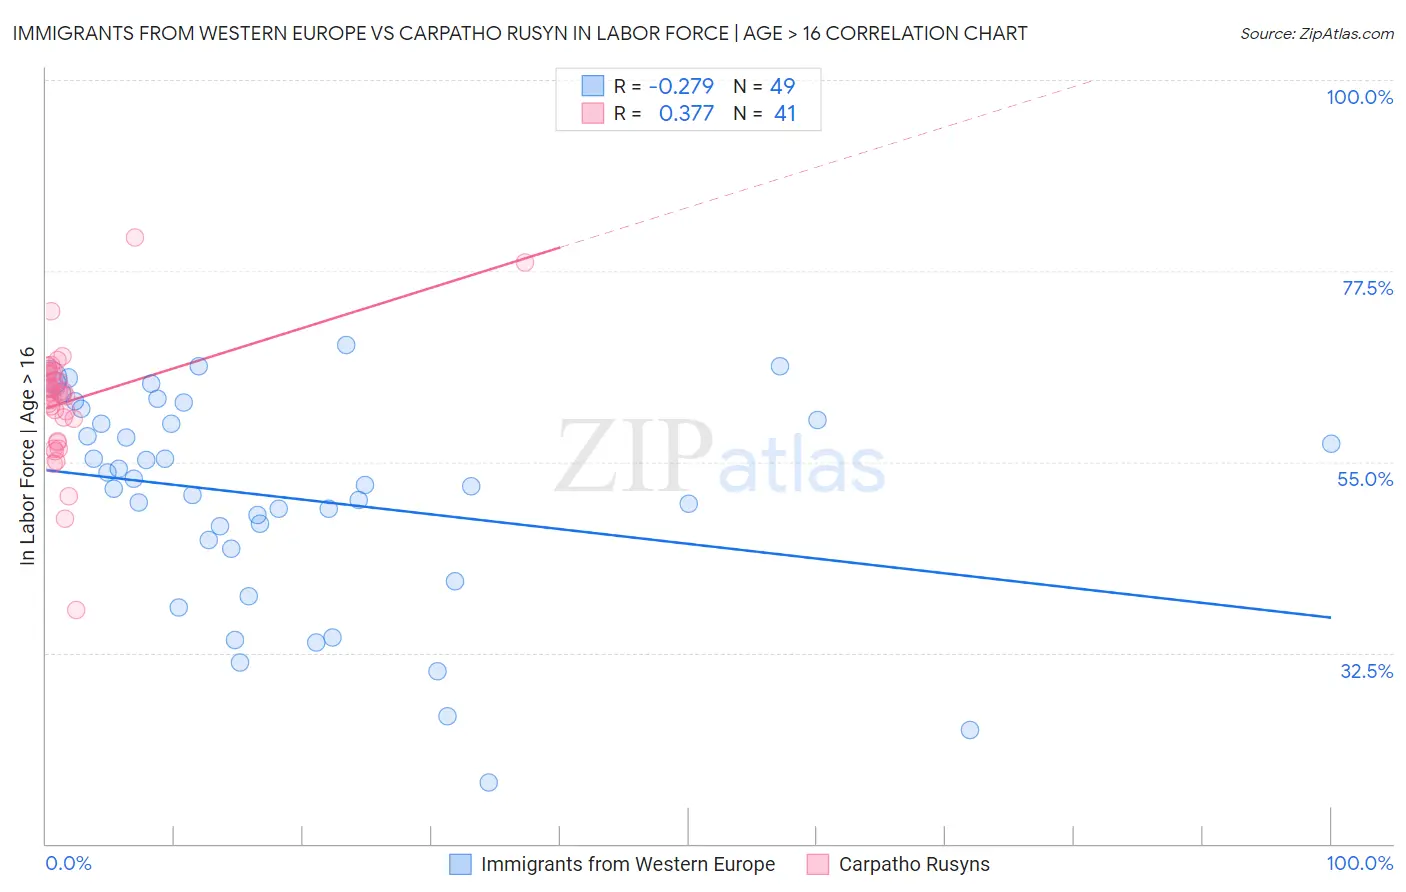
Immigrants from Western Europe vs Carpatho Rusyn In Labor Force | Age > 16 Correlation Chart
The statistical analysis conducted on geographies consisting of 494,084,612 people shows a weak negative correlation between the proportion of Immigrants from Western Europe and labor force participation rate among population ages 16 and over in the United States with a correlation coefficient (R) of -0.279 and weighted average of 64.2%. Similarly, the statistical analysis conducted on geographies consisting of 58,872,150 people shows a mild positive correlation between the proportion of Carpatho Rusyns and labor force participation rate among population ages 16 and over in the United States with a correlation coefficient (R) of 0.377 and weighted average of 65.0%, a difference of 1.3%.
In Labor Force | Age > 16 Correlation Summary
| Measurement | Immigrants from Western Europe | Carpatho Rusyn |
| Minimum | 17.2% | 37.5% |
| Maximum | 68.8% | 81.5% |
| Range | 51.6% | 44.0% |
| Mean | 50.8% | 62.2% |
| Median | 52.2% | 63.2% |
| Interquartile 25% (IQ1) | 45.2% | 58.8% |
| Interquartile 75% (IQ3) | 60.6% | 65.5% |
| Interquartile Range (IQR) | 15.4% | 6.7% |
| Standard Deviation (Sample) | 12.4% | 7.3% |
| Standard Deviation (Population) | 12.2% | 7.2% |
Similar Demographics by In Labor Force | Age > 16
Demographics Similar to Immigrants from Western Europe by In Labor Force | Age > 16
In terms of in labor force | age > 16, the demographic groups most similar to Immigrants from Western Europe are Marshallese (64.2%, a difference of 0.010%), Basque (64.2%, a difference of 0.010%), Finnish (64.2%, a difference of 0.020%), Immigrants from Scotland (64.2%, a difference of 0.030%), and Bahamian (64.2%, a difference of 0.040%).
| Demographics | Rating | Rank | In Labor Force | Age > 16 |
| Immigrants | Dominican Republic | 1.5 /100 | #252 | Tragic 64.4% |
| Czechoslovakians | 1.4 /100 | #253 | Tragic 64.3% |
| Immigrants | Uzbekistan | 1.4 /100 | #254 | Tragic 64.3% |
| Hispanics or Latinos | 1.1 /100 | #255 | Tragic 64.3% |
| Immigrants | Mexico | 1.0 /100 | #256 | Tragic 64.3% |
| Inupiat | 0.8 /100 | #257 | Tragic 64.3% |
| Immigrants | Scotland | 0.8 /100 | #258 | Tragic 64.2% |
| Immigrants | Western Europe | 0.7 /100 | #259 | Tragic 64.2% |
| Marshallese | 0.7 /100 | #260 | Tragic 64.2% |
| Basques | 0.7 /100 | #261 | Tragic 64.2% |
| Finns | 0.7 /100 | #262 | Tragic 64.2% |
| Bahamians | 0.6 /100 | #263 | Tragic 64.2% |
| Dutch | 0.6 /100 | #264 | Tragic 64.2% |
| Cubans | 0.5 /100 | #265 | Tragic 64.2% |
| Immigrants | England | 0.5 /100 | #266 | Tragic 64.2% |
Demographics Similar to Carpatho Rusyns by In Labor Force | Age > 16
In terms of in labor force | age > 16, the demographic groups most similar to Carpatho Rusyns are Syrian (65.0%, a difference of 0.0%), Immigrants from Nicaragua (65.1%, a difference of 0.010%), Soviet Union (65.0%, a difference of 0.010%), Immigrants from Switzerland (65.0%, a difference of 0.020%), and Immigrants from Latvia (65.1%, a difference of 0.030%).
| Demographics | Rating | Rank | In Labor Force | Age > 16 |
| Eastern Europeans | 46.2 /100 | #177 | Average 65.1% |
| Trinidadians and Tobagonians | 45.2 /100 | #178 | Average 65.1% |
| Immigrants | Haiti | 43.3 /100 | #179 | Average 65.1% |
| Immigrants | Latvia | 42.9 /100 | #180 | Average 65.1% |
| Immigrants | Panama | 42.4 /100 | #181 | Average 65.1% |
| Immigrants | Nicaragua | 41.1 /100 | #182 | Average 65.1% |
| Soviet Union | 40.5 /100 | #183 | Average 65.0% |
| Carpatho Rusyns | 40.0 /100 | #184 | Average 65.0% |
| Syrians | 40.0 /100 | #185 | Average 65.0% |
| Immigrants | Switzerland | 38.2 /100 | #186 | Fair 65.0% |
| Immigrants | Croatia | 35.7 /100 | #187 | Fair 65.0% |
| Immigrants | Portugal | 34.8 /100 | #188 | Fair 65.0% |
| Immigrants | Greece | 34.3 /100 | #189 | Fair 65.0% |
| Barbadians | 33.9 /100 | #190 | Fair 65.0% |
| Scandinavians | 33.7 /100 | #191 | Fair 65.0% |