Egyptian vs Inupiat In Labor Force | Age 16-19
COMPARE
Egyptian
Inupiat
In Labor Force | Age 16-19
In Labor Force | Age 16-19 Comparison
Egyptians
Inupiat
34.5%
IN LABOR FORCE | AGE 16-19
1.2/ 100
METRIC RATING
260th/ 347
METRIC RANK
35.0%
IN LABOR FORCE | AGE 16-19
3.2/ 100
METRIC RATING
239th/ 347
METRIC RANK
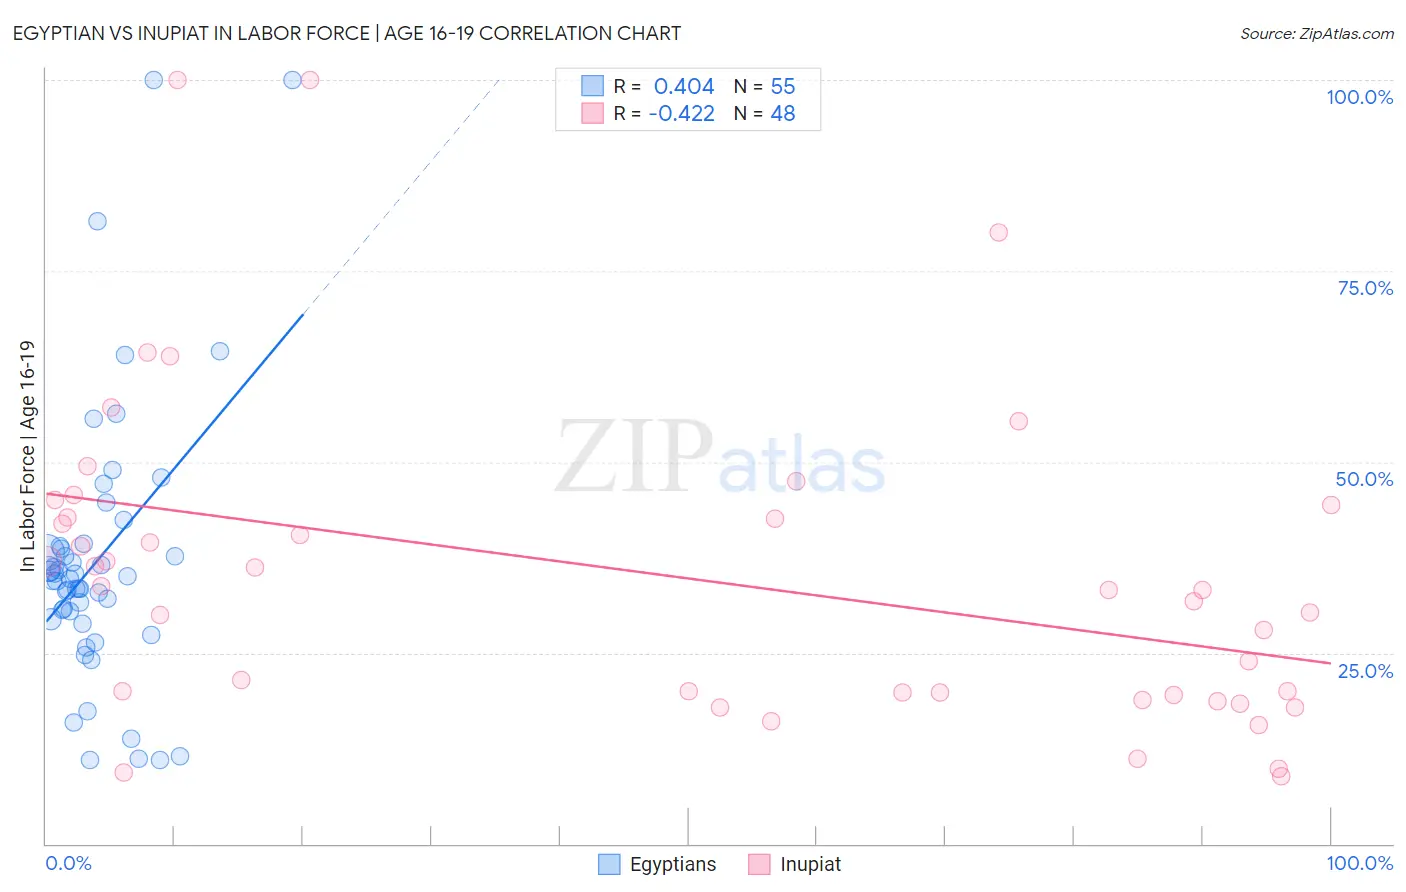
Egyptian vs Inupiat In Labor Force | Age 16-19 Correlation Chart
The statistical analysis conducted on geographies consisting of 276,688,548 people shows a moderate positive correlation between the proportion of Egyptians and labor force participation rate among population between the ages 16 and 19 in the United States with a correlation coefficient (R) of 0.404 and weighted average of 34.5%. Similarly, the statistical analysis conducted on geographies consisting of 96,280,453 people shows a moderate negative correlation between the proportion of Inupiat and labor force participation rate among population between the ages 16 and 19 in the United States with a correlation coefficient (R) of -0.422 and weighted average of 35.0%, a difference of 1.4%.
In Labor Force | Age 16-19 Correlation Summary
| Measurement | Egyptian | Inupiat |
| Minimum | 11.0% | 8.8% |
| Maximum | 100.0% | 100.0% |
| Range | 89.0% | 91.2% |
| Mean | 37.1% | 35.2% |
| Median | 34.7% | 33.3% |
| Interquartile 25% (IQ1) | 29.4% | 19.6% |
| Interquartile 75% (IQ3) | 39.0% | 43.6% |
| Interquartile Range (IQR) | 9.6% | 24.0% |
| Standard Deviation (Sample) | 18.1% | 20.9% |
| Standard Deviation (Population) | 17.9% | 20.6% |
Similar Demographics by In Labor Force | Age 16-19
Demographics Similar to Egyptians by In Labor Force | Age 16-19
In terms of in labor force | age 16-19, the demographic groups most similar to Egyptians are Salvadoran (34.5%, a difference of 0.040%), Hispanic or Latino (34.5%, a difference of 0.050%), Immigrants (34.6%, a difference of 0.080%), Burmese (34.5%, a difference of 0.090%), and Immigrants from Egypt (34.6%, a difference of 0.10%).
| Demographics | Rating | Rank | In Labor Force | Age 16-19 |
| Immigrants | Japan | 1.5 /100 | #253 | Tragic 34.7% |
| Bahamians | 1.4 /100 | #254 | Tragic 34.6% |
| Peruvians | 1.4 /100 | #255 | Tragic 34.6% |
| Immigrants | South Central Asia | 1.3 /100 | #256 | Tragic 34.6% |
| Immigrants | Egypt | 1.2 /100 | #257 | Tragic 34.6% |
| Thais | 1.2 /100 | #258 | Tragic 34.6% |
| Immigrants | Immigrants | 1.2 /100 | #259 | Tragic 34.6% |
| Egyptians | 1.2 /100 | #260 | Tragic 34.5% |
| Salvadorans | 1.1 /100 | #261 | Tragic 34.5% |
| Hispanics or Latinos | 1.1 /100 | #262 | Tragic 34.5% |
| Burmese | 1.1 /100 | #263 | Tragic 34.5% |
| Immigrants | Uruguay | 0.9 /100 | #264 | Tragic 34.4% |
| Immigrants | El Salvador | 0.7 /100 | #265 | Tragic 34.3% |
| Immigrants | Malaysia | 0.7 /100 | #266 | Tragic 34.3% |
| Immigrants | Peru | 0.5 /100 | #267 | Tragic 34.2% |
Demographics Similar to Inupiat by In Labor Force | Age 16-19
In terms of in labor force | age 16-19, the demographic groups most similar to Inupiat are Immigrants from Vietnam (35.0%, a difference of 0.090%), Immigrants from Central America (35.0%, a difference of 0.10%), Immigrants from Ireland (35.0%, a difference of 0.13%), Immigrants from India (35.0%, a difference of 0.14%), and Immigrants from Australia (35.1%, a difference of 0.16%).
| Demographics | Rating | Rank | In Labor Force | Age 16-19 |
| Immigrants | Kazakhstan | 4.5 /100 | #232 | Tragic 35.2% |
| Immigrants | France | 4.3 /100 | #233 | Tragic 35.1% |
| Immigrants | Mexico | 4.2 /100 | #234 | Tragic 35.1% |
| Immigrants | Philippines | 4.0 /100 | #235 | Tragic 35.1% |
| Immigrants | Australia | 3.6 /100 | #236 | Tragic 35.1% |
| Immigrants | India | 3.5 /100 | #237 | Tragic 35.0% |
| Immigrants | Vietnam | 3.4 /100 | #238 | Tragic 35.0% |
| Inupiat | 3.2 /100 | #239 | Tragic 35.0% |
| Immigrants | Central America | 3.0 /100 | #240 | Tragic 35.0% |
| Immigrants | Ireland | 2.9 /100 | #241 | Tragic 35.0% |
| Uruguayans | 2.6 /100 | #242 | Tragic 34.9% |
| Pueblo | 2.6 /100 | #243 | Tragic 34.9% |
| Immigrants | Turkey | 2.6 /100 | #244 | Tragic 34.9% |
| Immigrants | Greece | 2.4 /100 | #245 | Tragic 34.9% |
| Immigrants | Sri Lanka | 2.4 /100 | #246 | Tragic 34.9% |