Dominican vs Inupiat In Labor Force | Age 16-19
COMPARE
Dominican
Inupiat
In Labor Force | Age 16-19
In Labor Force | Age 16-19 Comparison
Dominicans
Inupiat
31.2%
IN LABOR FORCE | AGE 16-19
0.0/ 100
METRIC RATING
324th/ 347
METRIC RANK
35.0%
IN LABOR FORCE | AGE 16-19
3.2/ 100
METRIC RATING
239th/ 347
METRIC RANK
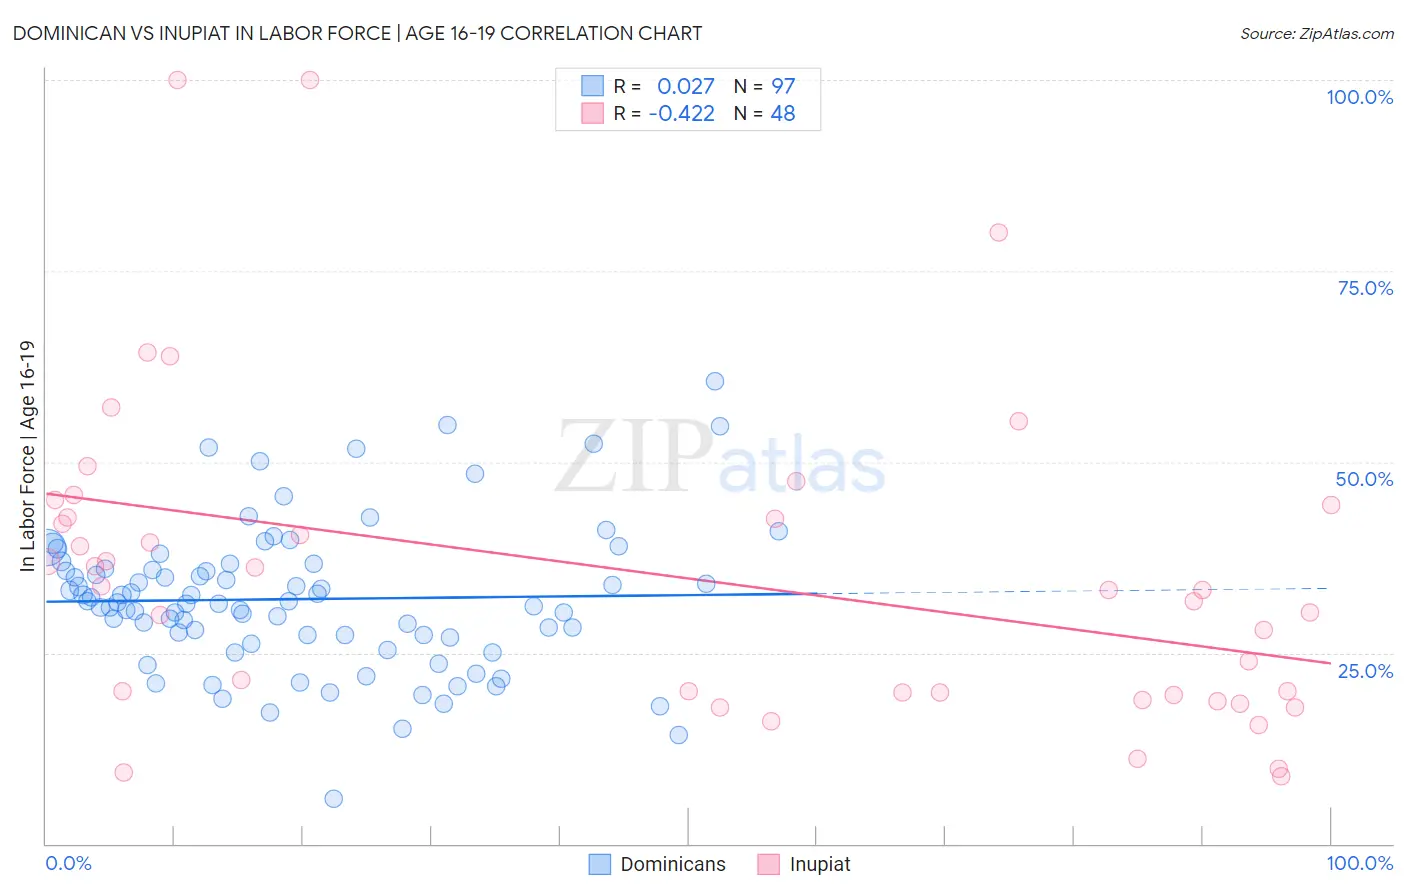
Dominican vs Inupiat In Labor Force | Age 16-19 Correlation Chart
The statistical analysis conducted on geographies consisting of 354,586,301 people shows no correlation between the proportion of Dominicans and labor force participation rate among population between the ages 16 and 19 in the United States with a correlation coefficient (R) of 0.027 and weighted average of 31.2%. Similarly, the statistical analysis conducted on geographies consisting of 96,280,453 people shows a moderate negative correlation between the proportion of Inupiat and labor force participation rate among population between the ages 16 and 19 in the United States with a correlation coefficient (R) of -0.422 and weighted average of 35.0%, a difference of 12.2%.
In Labor Force | Age 16-19 Correlation Summary
| Measurement | Dominican | Inupiat |
| Minimum | 5.9% | 8.8% |
| Maximum | 60.5% | 100.0% |
| Range | 54.6% | 91.2% |
| Mean | 32.0% | 35.2% |
| Median | 31.6% | 33.3% |
| Interquartile 25% (IQ1) | 27.2% | 19.6% |
| Interquartile 75% (IQ3) | 36.3% | 43.6% |
| Interquartile Range (IQR) | 9.2% | 24.0% |
| Standard Deviation (Sample) | 9.5% | 20.9% |
| Standard Deviation (Population) | 9.4% | 20.6% |
Similar Demographics by In Labor Force | Age 16-19
Demographics Similar to Dominicans by In Labor Force | Age 16-19
In terms of in labor force | age 16-19, the demographic groups most similar to Dominicans are Immigrants from China (31.1%, a difference of 0.15%), Immigrants from Caribbean (31.2%, a difference of 0.18%), Tohono O'odham (31.3%, a difference of 0.31%), Immigrants from Dominican Republic (31.1%, a difference of 0.35%), and West Indian (31.3%, a difference of 0.43%).
| Demographics | Rating | Rank | In Labor Force | Age 16-19 |
| Immigrants | Nicaragua | 0.0 /100 | #317 | Tragic 31.6% |
| Immigrants | Yemen | 0.0 /100 | #318 | Tragic 31.5% |
| Soviet Union | 0.0 /100 | #319 | Tragic 31.4% |
| Ecuadorians | 0.0 /100 | #320 | Tragic 31.4% |
| West Indians | 0.0 /100 | #321 | Tragic 31.3% |
| Tohono O'odham | 0.0 /100 | #322 | Tragic 31.3% |
| Immigrants | Caribbean | 0.0 /100 | #323 | Tragic 31.2% |
| Dominicans | 0.0 /100 | #324 | Tragic 31.2% |
| Immigrants | China | 0.0 /100 | #325 | Tragic 31.1% |
| Immigrants | Dominican Republic | 0.0 /100 | #326 | Tragic 31.1% |
| Immigrants | Taiwan | 0.0 /100 | #327 | Tragic 31.0% |
| Immigrants | Ecuador | 0.0 /100 | #328 | Tragic 31.0% |
| Barbadians | 0.0 /100 | #329 | Tragic 31.0% |
| Lumbee | 0.0 /100 | #330 | Tragic 31.0% |
| Trinidadians and Tobagonians | 0.0 /100 | #331 | Tragic 30.9% |
Demographics Similar to Inupiat by In Labor Force | Age 16-19
In terms of in labor force | age 16-19, the demographic groups most similar to Inupiat are Immigrants from Vietnam (35.0%, a difference of 0.090%), Immigrants from Central America (35.0%, a difference of 0.10%), Immigrants from Ireland (35.0%, a difference of 0.13%), Immigrants from India (35.0%, a difference of 0.14%), and Immigrants from Australia (35.1%, a difference of 0.16%).
| Demographics | Rating | Rank | In Labor Force | Age 16-19 |
| Immigrants | Kazakhstan | 4.5 /100 | #232 | Tragic 35.2% |
| Immigrants | France | 4.3 /100 | #233 | Tragic 35.1% |
| Immigrants | Mexico | 4.2 /100 | #234 | Tragic 35.1% |
| Immigrants | Philippines | 4.0 /100 | #235 | Tragic 35.1% |
| Immigrants | Australia | 3.6 /100 | #236 | Tragic 35.1% |
| Immigrants | India | 3.5 /100 | #237 | Tragic 35.0% |
| Immigrants | Vietnam | 3.4 /100 | #238 | Tragic 35.0% |
| Inupiat | 3.2 /100 | #239 | Tragic 35.0% |
| Immigrants | Central America | 3.0 /100 | #240 | Tragic 35.0% |
| Immigrants | Ireland | 2.9 /100 | #241 | Tragic 35.0% |
| Uruguayans | 2.6 /100 | #242 | Tragic 34.9% |
| Pueblo | 2.6 /100 | #243 | Tragic 34.9% |
| Immigrants | Turkey | 2.6 /100 | #244 | Tragic 34.9% |
| Immigrants | Greece | 2.4 /100 | #245 | Tragic 34.9% |
| Immigrants | Sri Lanka | 2.4 /100 | #246 | Tragic 34.9% |