Immigrants from Switzerland vs Inupiat Male Unemployment
COMPARE
Immigrants from Switzerland
Inupiat
Male Unemployment
Male Unemployment Comparison
Immigrants from Switzerland
Inupiat
5.2%
MALE UNEMPLOYMENT
79.2/ 100
METRIC RATING
141st/ 347
METRIC RANK
12.1%
MALE UNEMPLOYMENT
0.0/ 100
METRIC RATING
346th/ 347
METRIC RANK
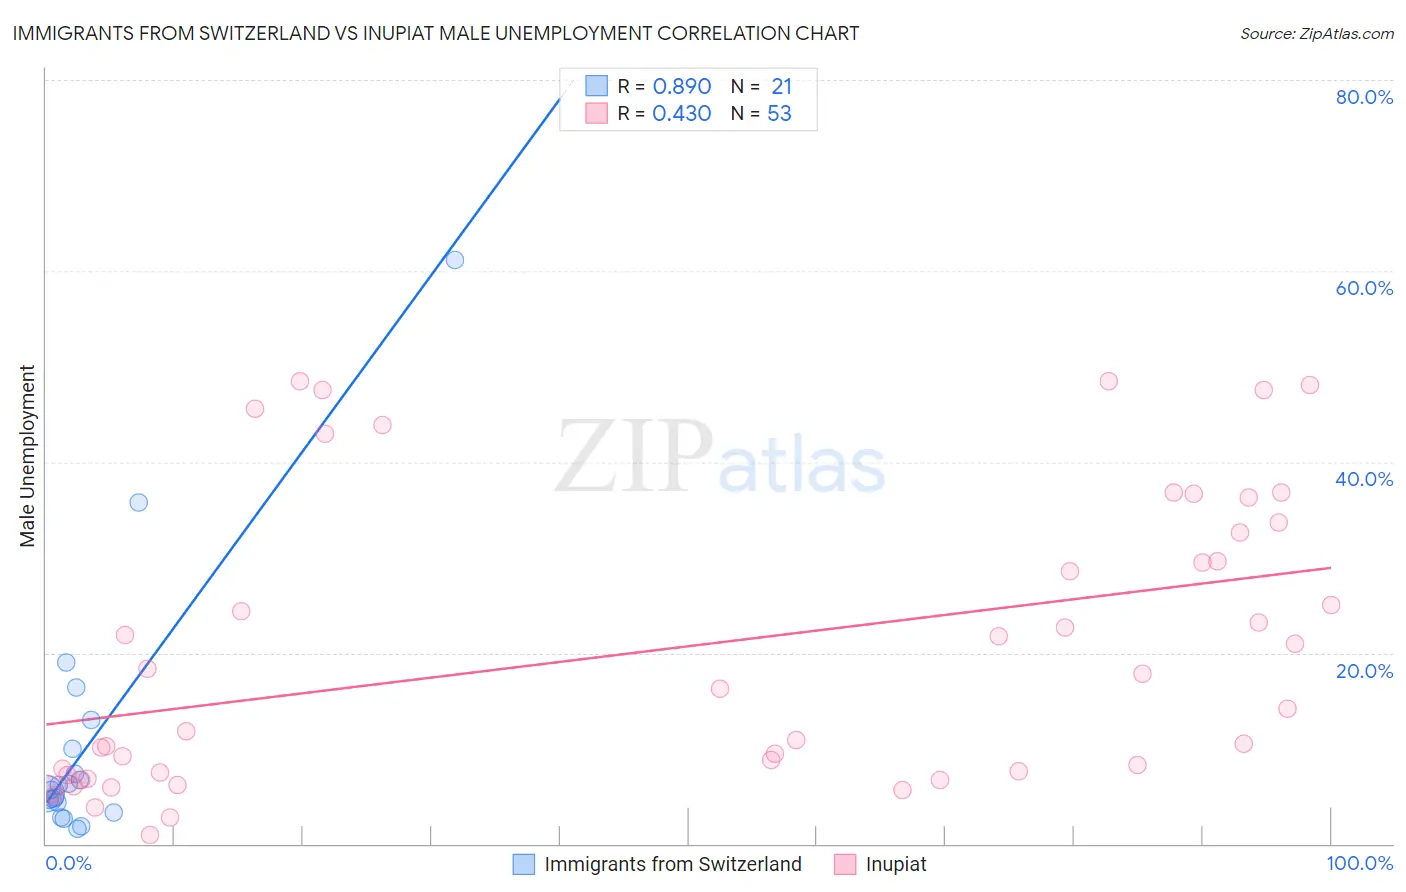
Immigrants from Switzerland vs Inupiat Male Unemployment Correlation Chart
The statistical analysis conducted on geographies consisting of 147,847,273 people shows a very strong positive correlation between the proportion of Immigrants from Switzerland and unemployment rate among males in the United States with a correlation coefficient (R) of 0.890 and weighted average of 5.2%. Similarly, the statistical analysis conducted on geographies consisting of 96,169,254 people shows a moderate positive correlation between the proportion of Inupiat and unemployment rate among males in the United States with a correlation coefficient (R) of 0.430 and weighted average of 12.1%, a difference of 132.6%.
Male Unemployment Correlation Summary
| Measurement | Immigrants from Switzerland | Inupiat |
| Minimum | 1.6% | 0.90% |
| Maximum | 61.1% | 48.5% |
| Range | 59.5% | 47.6% |
| Mean | 10.6% | 20.4% |
| Median | 5.6% | 16.2% |
| Interquartile 25% (IQ1) | 3.8% | 7.3% |
| Interquartile 75% (IQ3) | 11.5% | 33.1% |
| Interquartile Range (IQR) | 7.7% | 25.8% |
| Standard Deviation (Sample) | 13.9% | 15.0% |
| Standard Deviation (Population) | 13.6% | 14.9% |
Similar Demographics by Male Unemployment
Demographics Similar to Immigrants from Switzerland by Male Unemployment
In terms of male unemployment, the demographic groups most similar to Immigrants from Switzerland are Brazilian (5.2%, a difference of 0.010%), Kenyan (5.2%, a difference of 0.020%), Immigrants from Croatia (5.2%, a difference of 0.040%), Immigrants from Eastern Africa (5.2%, a difference of 0.050%), and Lebanese (5.2%, a difference of 0.060%).
| Demographics | Rating | Rank | Male Unemployment |
| Pakistanis | 80.5 /100 | #134 | Excellent 5.2% |
| Immigrants | Saudi Arabia | 80.1 /100 | #135 | Excellent 5.2% |
| Lebanese | 79.9 /100 | #136 | Good 5.2% |
| Immigrants | Eastern Africa | 79.8 /100 | #137 | Good 5.2% |
| Immigrants | Croatia | 79.7 /100 | #138 | Good 5.2% |
| Kenyans | 79.4 /100 | #139 | Good 5.2% |
| Brazilians | 79.3 /100 | #140 | Good 5.2% |
| Immigrants | Switzerland | 79.2 /100 | #141 | Good 5.2% |
| Fijians | 78.3 /100 | #142 | Good 5.2% |
| Syrians | 78.0 /100 | #143 | Good 5.2% |
| Sri Lankans | 77.9 /100 | #144 | Good 5.2% |
| Macedonians | 77.7 /100 | #145 | Good 5.2% |
| Immigrants | Kenya | 77.6 /100 | #146 | Good 5.2% |
| Immigrants | Burma/Myanmar | 77.5 /100 | #147 | Good 5.2% |
| Immigrants | Italy | 76.3 /100 | #148 | Good 5.2% |
Demographics Similar to Inupiat by Male Unemployment
In terms of male unemployment, the demographic groups most similar to Inupiat are Arapaho (11.0%, a difference of 9.8%), Hopi (10.8%, a difference of 12.0%), Crow (10.6%, a difference of 13.8%), Tohono O'odham (10.2%, a difference of 18.8%), and Navajo (9.8%, a difference of 22.9%).
| Demographics | Rating | Rank | Male Unemployment |
| Sioux | 0.0 /100 | #333 | Tragic 8.4% |
| Tsimshian | 0.0 /100 | #334 | Tragic 8.5% |
| Pueblo | 0.0 /100 | #335 | Tragic 8.5% |
| Yuman | 0.0 /100 | #336 | Tragic 8.6% |
| Puerto Ricans | 0.0 /100 | #337 | Tragic 8.6% |
| Apache | 0.0 /100 | #338 | Tragic 8.6% |
| Cheyenne | 0.0 /100 | #339 | Tragic 9.8% |
| Alaskan Athabascans | 0.0 /100 | #340 | Tragic 9.8% |
| Navajo | 0.0 /100 | #341 | Tragic 9.8% |
| Tohono O'odham | 0.0 /100 | #342 | Tragic 10.2% |
| Crow | 0.0 /100 | #343 | Tragic 10.6% |
| Hopi | 0.0 /100 | #344 | Tragic 10.8% |
| Arapaho | 0.0 /100 | #345 | Tragic 11.0% |
| Inupiat | 0.0 /100 | #346 | Tragic 12.1% |
| Yup'ik | 0.0 /100 | #347 | Tragic 16.4% |