Immigrants from Latvia vs Inupiat In Labor Force | Age 16-19
COMPARE
Immigrants from Latvia
Inupiat
In Labor Force | Age 16-19
In Labor Force | Age 16-19 Comparison
Immigrants from Latvia
Inupiat
36.8%
IN LABOR FORCE | AGE 16-19
61.6/ 100
METRIC RATING
169th/ 347
METRIC RANK
35.0%
IN LABOR FORCE | AGE 16-19
3.2/ 100
METRIC RATING
239th/ 347
METRIC RANK
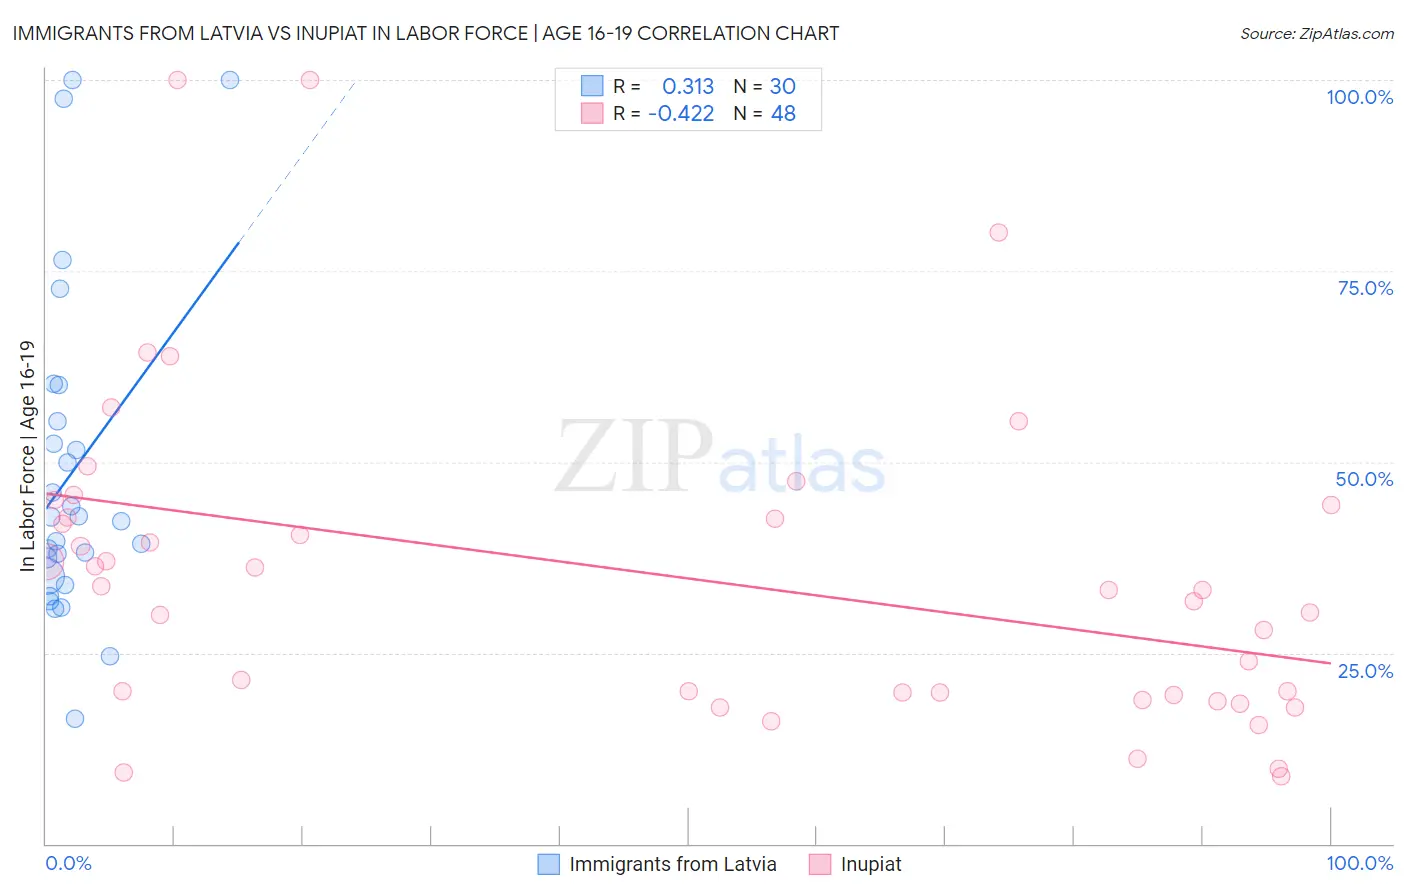
Immigrants from Latvia vs Inupiat In Labor Force | Age 16-19 Correlation Chart
The statistical analysis conducted on geographies consisting of 113,686,535 people shows a mild positive correlation between the proportion of Immigrants from Latvia and labor force participation rate among population between the ages 16 and 19 in the United States with a correlation coefficient (R) of 0.313 and weighted average of 36.8%. Similarly, the statistical analysis conducted on geographies consisting of 96,280,453 people shows a moderate negative correlation between the proportion of Inupiat and labor force participation rate among population between the ages 16 and 19 in the United States with a correlation coefficient (R) of -0.422 and weighted average of 35.0%, a difference of 5.1%.
In Labor Force | Age 16-19 Correlation Summary
| Measurement | Immigrants from Latvia | Inupiat |
| Minimum | 16.4% | 8.8% |
| Maximum | 100.0% | 100.0% |
| Range | 83.6% | 91.2% |
| Mean | 48.7% | 35.2% |
| Median | 42.6% | 33.3% |
| Interquartile 25% (IQ1) | 35.0% | 19.6% |
| Interquartile 75% (IQ3) | 55.3% | 43.6% |
| Interquartile Range (IQR) | 20.3% | 24.0% |
| Standard Deviation (Sample) | 21.4% | 20.9% |
| Standard Deviation (Population) | 21.1% | 20.6% |
Similar Demographics by In Labor Force | Age 16-19
Demographics Similar to Immigrants from Latvia by In Labor Force | Age 16-19
In terms of in labor force | age 16-19, the demographic groups most similar to Immigrants from Latvia are Immigrants from South Africa (36.8%, a difference of 0.060%), Palestinian (36.8%, a difference of 0.080%), Arab (36.8%, a difference of 0.11%), Immigrants from Cambodia (36.7%, a difference of 0.17%), and South African (36.7%, a difference of 0.17%).
| Demographics | Rating | Rank | In Labor Force | Age 16-19 |
| Immigrants | Jordan | 69.5 /100 | #162 | Good 36.9% |
| Bermudans | 69.3 /100 | #163 | Good 36.9% |
| Immigrants | Kuwait | 68.9 /100 | #164 | Good 36.9% |
| Yakama | 66.9 /100 | #165 | Good 36.9% |
| Immigrants | Western Africa | 66.7 /100 | #166 | Good 36.9% |
| Arabs | 63.6 /100 | #167 | Good 36.8% |
| Palestinians | 63.1 /100 | #168 | Good 36.8% |
| Immigrants | Latvia | 61.6 /100 | #169 | Good 36.8% |
| Immigrants | South Africa | 60.5 /100 | #170 | Good 36.8% |
| Immigrants | Cambodia | 58.4 /100 | #171 | Average 36.7% |
| South Africans | 58.3 /100 | #172 | Average 36.7% |
| Russians | 57.5 /100 | #173 | Average 36.7% |
| Immigrants | Czechoslovakia | 50.0 /100 | #174 | Average 36.6% |
| Natives/Alaskans | 49.0 /100 | #175 | Average 36.6% |
| Albanians | 48.8 /100 | #176 | Average 36.5% |
Demographics Similar to Inupiat by In Labor Force | Age 16-19
In terms of in labor force | age 16-19, the demographic groups most similar to Inupiat are Immigrants from Vietnam (35.0%, a difference of 0.090%), Immigrants from Central America (35.0%, a difference of 0.10%), Immigrants from Ireland (35.0%, a difference of 0.13%), Immigrants from India (35.0%, a difference of 0.14%), and Immigrants from Australia (35.1%, a difference of 0.16%).
| Demographics | Rating | Rank | In Labor Force | Age 16-19 |
| Immigrants | Kazakhstan | 4.5 /100 | #232 | Tragic 35.2% |
| Immigrants | France | 4.3 /100 | #233 | Tragic 35.1% |
| Immigrants | Mexico | 4.2 /100 | #234 | Tragic 35.1% |
| Immigrants | Philippines | 4.0 /100 | #235 | Tragic 35.1% |
| Immigrants | Australia | 3.6 /100 | #236 | Tragic 35.1% |
| Immigrants | India | 3.5 /100 | #237 | Tragic 35.0% |
| Immigrants | Vietnam | 3.4 /100 | #238 | Tragic 35.0% |
| Inupiat | 3.2 /100 | #239 | Tragic 35.0% |
| Immigrants | Central America | 3.0 /100 | #240 | Tragic 35.0% |
| Immigrants | Ireland | 2.9 /100 | #241 | Tragic 35.0% |
| Uruguayans | 2.6 /100 | #242 | Tragic 34.9% |
| Pueblo | 2.6 /100 | #243 | Tragic 34.9% |
| Immigrants | Turkey | 2.6 /100 | #244 | Tragic 34.9% |
| Immigrants | Greece | 2.4 /100 | #245 | Tragic 34.9% |
| Immigrants | Sri Lanka | 2.4 /100 | #246 | Tragic 34.9% |