Ugandan vs Immigrants from Malaysia In Labor Force | Age 16-19
COMPARE
Ugandan
Immigrants from Malaysia
In Labor Force | Age 16-19
In Labor Force | Age 16-19 Comparison
Ugandans
Immigrants from Malaysia
38.9%
IN LABOR FORCE | AGE 16-19
99.3/ 100
METRIC RATING
98th/ 347
METRIC RANK
34.3%
IN LABOR FORCE | AGE 16-19
0.7/ 100
METRIC RATING
266th/ 347
METRIC RANK
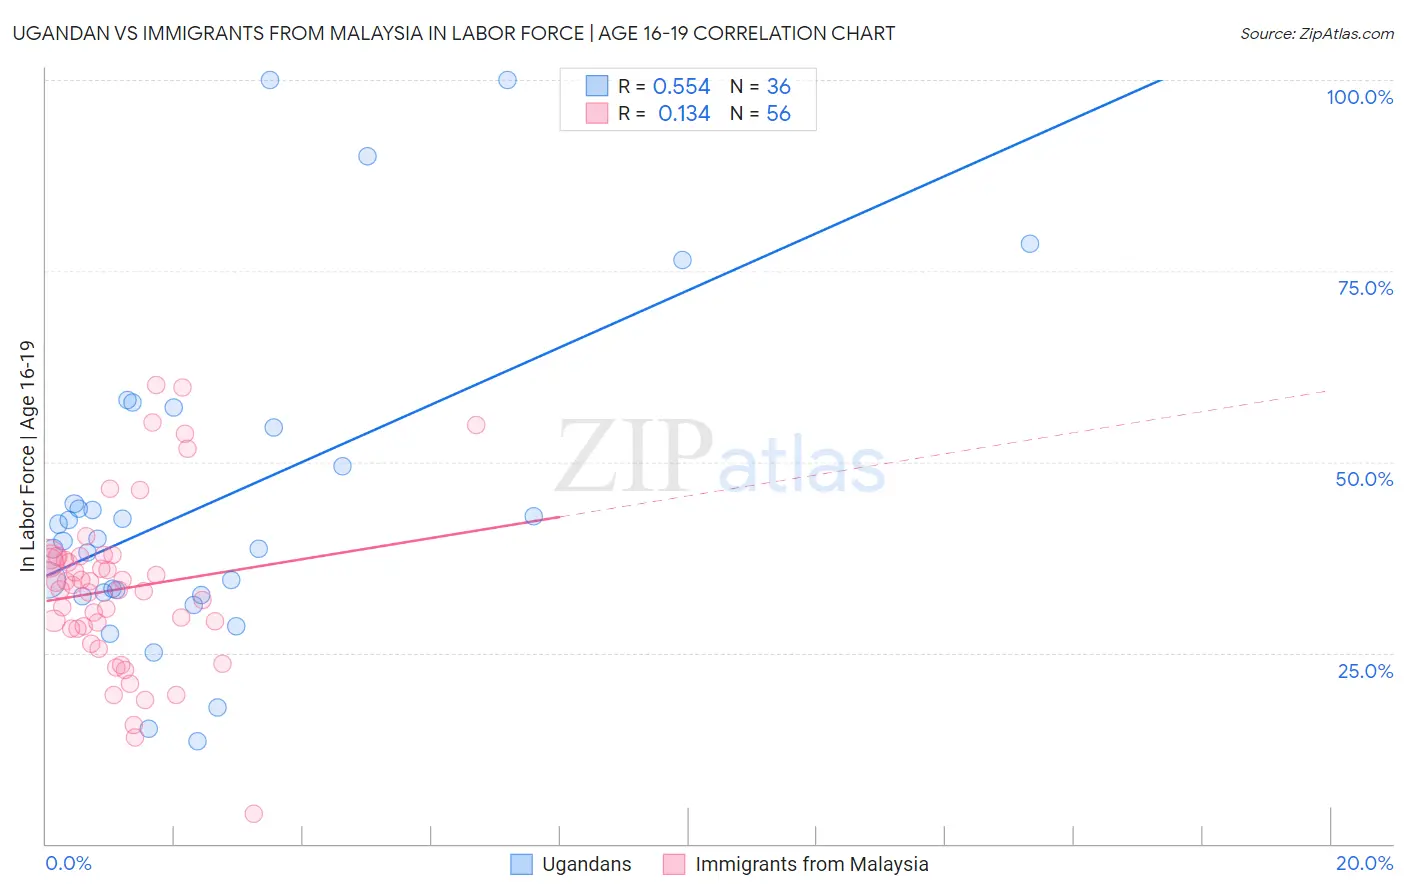
Ugandan vs Immigrants from Malaysia In Labor Force | Age 16-19 Correlation Chart
The statistical analysis conducted on geographies consisting of 94,006,992 people shows a substantial positive correlation between the proportion of Ugandans and labor force participation rate among population between the ages 16 and 19 in the United States with a correlation coefficient (R) of 0.554 and weighted average of 38.9%. Similarly, the statistical analysis conducted on geographies consisting of 197,895,635 people shows a poor positive correlation between the proportion of Immigrants from Malaysia and labor force participation rate among population between the ages 16 and 19 in the United States with a correlation coefficient (R) of 0.134 and weighted average of 34.3%, a difference of 13.4%.
In Labor Force | Age 16-19 Correlation Summary
| Measurement | Ugandan | Immigrants from Malaysia |
| Minimum | 13.5% | 4.0% |
| Maximum | 100.0% | 60.1% |
| Range | 86.5% | 56.1% |
| Mean | 44.8% | 33.4% |
| Median | 39.8% | 33.6% |
| Interquartile 25% (IQ1) | 32.7% | 28.1% |
| Interquartile 75% (IQ3) | 52.0% | 37.5% |
| Interquartile Range (IQR) | 19.3% | 9.4% |
| Standard Deviation (Sample) | 21.2% | 11.0% |
| Standard Deviation (Population) | 20.9% | 10.9% |
Similar Demographics by In Labor Force | Age 16-19
Demographics Similar to Ugandans by In Labor Force | Age 16-19
In terms of in labor force | age 16-19, the demographic groups most similar to Ugandans are Greek (38.9%, a difference of 0.010%), Immigrants from North Macedonia (38.9%, a difference of 0.020%), Latvian (38.9%, a difference of 0.050%), Immigrants from North America (38.9%, a difference of 0.080%), and Blackfeet (38.9%, a difference of 0.17%).
| Demographics | Rating | Rank | In Labor Force | Age 16-19 |
| Spanish Americans | 99.5 /100 | #91 | Exceptional 39.0% |
| Osage | 99.4 /100 | #92 | Exceptional 39.0% |
| Blackfeet | 99.4 /100 | #93 | Exceptional 38.9% |
| Immigrants | Canada | 99.4 /100 | #94 | Exceptional 38.9% |
| Immigrants | North America | 99.4 /100 | #95 | Exceptional 38.9% |
| Latvians | 99.4 /100 | #96 | Exceptional 38.9% |
| Greeks | 99.3 /100 | #97 | Exceptional 38.9% |
| Ugandans | 99.3 /100 | #98 | Exceptional 38.9% |
| Immigrants | North Macedonia | 99.3 /100 | #99 | Exceptional 38.9% |
| Immigrants | Thailand | 99.1 /100 | #100 | Exceptional 38.7% |
| Hmong | 99.1 /100 | #101 | Exceptional 38.7% |
| Zimbabweans | 99.1 /100 | #102 | Exceptional 38.7% |
| Immigrants | Cameroon | 99.0 /100 | #103 | Exceptional 38.7% |
| Immigrants | Eritrea | 99.0 /100 | #104 | Exceptional 38.7% |
| Iraqis | 98.9 /100 | #105 | Exceptional 38.6% |
Demographics Similar to Immigrants from Malaysia by In Labor Force | Age 16-19
In terms of in labor force | age 16-19, the demographic groups most similar to Immigrants from Malaysia are Immigrants from El Salvador (34.3%, a difference of 0.090%), Immigrants from Uruguay (34.4%, a difference of 0.33%), Immigrants from Peru (34.2%, a difference of 0.36%), Immigrants from Asia (34.1%, a difference of 0.48%), and Pima (34.1%, a difference of 0.56%).
| Demographics | Rating | Rank | In Labor Force | Age 16-19 |
| Immigrants | Immigrants | 1.2 /100 | #259 | Tragic 34.6% |
| Egyptians | 1.2 /100 | #260 | Tragic 34.5% |
| Salvadorans | 1.1 /100 | #261 | Tragic 34.5% |
| Hispanics or Latinos | 1.1 /100 | #262 | Tragic 34.5% |
| Burmese | 1.1 /100 | #263 | Tragic 34.5% |
| Immigrants | Uruguay | 0.9 /100 | #264 | Tragic 34.4% |
| Immigrants | El Salvador | 0.7 /100 | #265 | Tragic 34.3% |
| Immigrants | Malaysia | 0.7 /100 | #266 | Tragic 34.3% |
| Immigrants | Peru | 0.5 /100 | #267 | Tragic 34.2% |
| Immigrants | Asia | 0.5 /100 | #268 | Tragic 34.1% |
| Pima | 0.5 /100 | #269 | Tragic 34.1% |
| Immigrants | Russia | 0.4 /100 | #270 | Tragic 34.1% |
| Central American Indians | 0.4 /100 | #271 | Tragic 34.1% |
| Asians | 0.4 /100 | #272 | Tragic 34.1% |
| Immigrants | Panama | 0.4 /100 | #273 | Tragic 34.0% |