Immigrants from Dominica vs Immigrants from Malaysia In Labor Force | Age 16-19
COMPARE
Immigrants from Dominica
Immigrants from Malaysia
In Labor Force | Age 16-19
In Labor Force | Age 16-19 Comparison
Immigrants from Dominica
Immigrants from Malaysia
32.5%
IN LABOR FORCE | AGE 16-19
0.0/ 100
METRIC RATING
303rd/ 347
METRIC RANK
34.3%
IN LABOR FORCE | AGE 16-19
0.7/ 100
METRIC RATING
266th/ 347
METRIC RANK
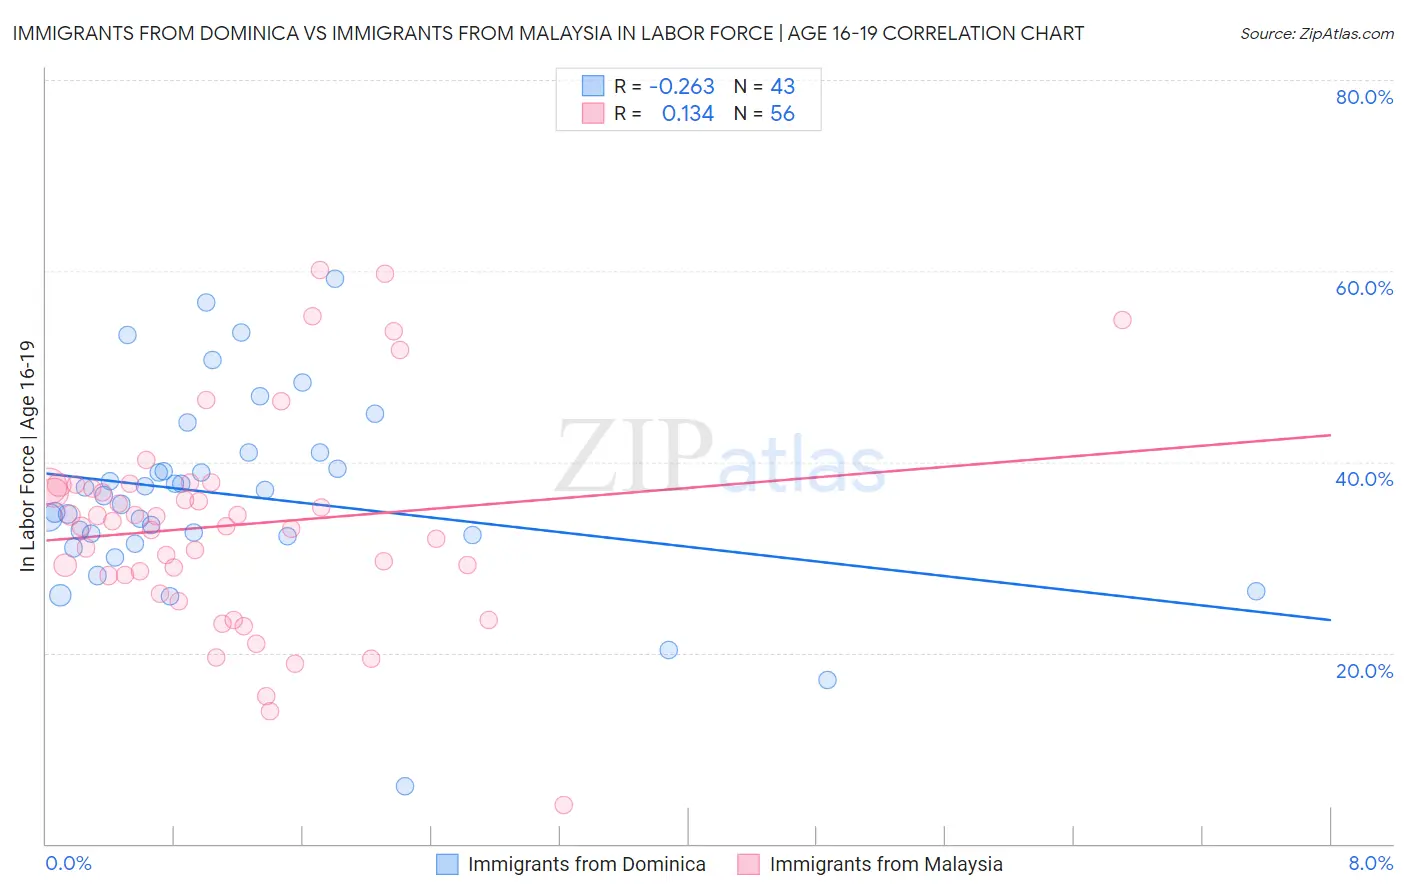
Immigrants from Dominica vs Immigrants from Malaysia In Labor Force | Age 16-19 Correlation Chart
The statistical analysis conducted on geographies consisting of 83,778,469 people shows a weak negative correlation between the proportion of Immigrants from Dominica and labor force participation rate among population between the ages 16 and 19 in the United States with a correlation coefficient (R) of -0.263 and weighted average of 32.5%. Similarly, the statistical analysis conducted on geographies consisting of 197,895,635 people shows a poor positive correlation between the proportion of Immigrants from Malaysia and labor force participation rate among population between the ages 16 and 19 in the United States with a correlation coefficient (R) of 0.134 and weighted average of 34.3%, a difference of 5.6%.
In Labor Force | Age 16-19 Correlation Summary
| Measurement | Immigrants from Dominica | Immigrants from Malaysia |
| Minimum | 6.0% | 4.0% |
| Maximum | 59.2% | 60.1% |
| Range | 53.2% | 56.1% |
| Mean | 36.5% | 33.4% |
| Median | 36.5% | 33.6% |
| Interquartile 25% (IQ1) | 32.3% | 28.1% |
| Interquartile 75% (IQ3) | 41.0% | 37.5% |
| Interquartile Range (IQR) | 8.7% | 9.4% |
| Standard Deviation (Sample) | 10.1% | 11.0% |
| Standard Deviation (Population) | 10.0% | 10.9% |
Similar Demographics by In Labor Force | Age 16-19
Demographics Similar to Immigrants from Dominica by In Labor Force | Age 16-19
In terms of in labor force | age 16-19, the demographic groups most similar to Immigrants from Dominica are Israeli (32.4%, a difference of 0.19%), Nicaraguan (32.4%, a difference of 0.24%), Spanish American Indian (32.4%, a difference of 0.37%), Immigrants from Jamaica (32.2%, a difference of 0.86%), and Belizean (32.8%, a difference of 0.90%).
| Demographics | Rating | Rank | In Labor Force | Age 16-19 |
| Jamaicans | 0.1 /100 | #296 | Tragic 33.2% |
| Immigrants | Haiti | 0.1 /100 | #297 | Tragic 33.2% |
| Iranians | 0.0 /100 | #298 | Tragic 33.0% |
| Armenians | 0.0 /100 | #299 | Tragic 32.9% |
| Immigrants | Argentina | 0.0 /100 | #300 | Tragic 32.9% |
| Okinawans | 0.0 /100 | #301 | Tragic 32.8% |
| Belizeans | 0.0 /100 | #302 | Tragic 32.8% |
| Immigrants | Dominica | 0.0 /100 | #303 | Tragic 32.5% |
| Israelis | 0.0 /100 | #304 | Tragic 32.4% |
| Nicaraguans | 0.0 /100 | #305 | Tragic 32.4% |
| Spanish American Indians | 0.0 /100 | #306 | Tragic 32.4% |
| Immigrants | Jamaica | 0.0 /100 | #307 | Tragic 32.2% |
| Navajo | 0.0 /100 | #308 | Tragic 32.1% |
| Immigrants | Eastern Asia | 0.0 /100 | #309 | Tragic 32.0% |
| Immigrants | Iran | 0.0 /100 | #310 | Tragic 32.0% |
Demographics Similar to Immigrants from Malaysia by In Labor Force | Age 16-19
In terms of in labor force | age 16-19, the demographic groups most similar to Immigrants from Malaysia are Immigrants from El Salvador (34.3%, a difference of 0.090%), Immigrants from Uruguay (34.4%, a difference of 0.33%), Immigrants from Peru (34.2%, a difference of 0.36%), Immigrants from Asia (34.1%, a difference of 0.48%), and Pima (34.1%, a difference of 0.56%).
| Demographics | Rating | Rank | In Labor Force | Age 16-19 |
| Immigrants | Immigrants | 1.2 /100 | #259 | Tragic 34.6% |
| Egyptians | 1.2 /100 | #260 | Tragic 34.5% |
| Salvadorans | 1.1 /100 | #261 | Tragic 34.5% |
| Hispanics or Latinos | 1.1 /100 | #262 | Tragic 34.5% |
| Burmese | 1.1 /100 | #263 | Tragic 34.5% |
| Immigrants | Uruguay | 0.9 /100 | #264 | Tragic 34.4% |
| Immigrants | El Salvador | 0.7 /100 | #265 | Tragic 34.3% |
| Immigrants | Malaysia | 0.7 /100 | #266 | Tragic 34.3% |
| Immigrants | Peru | 0.5 /100 | #267 | Tragic 34.2% |
| Immigrants | Asia | 0.5 /100 | #268 | Tragic 34.1% |
| Pima | 0.5 /100 | #269 | Tragic 34.1% |
| Immigrants | Russia | 0.4 /100 | #270 | Tragic 34.1% |
| Central American Indians | 0.4 /100 | #271 | Tragic 34.1% |
| Asians | 0.4 /100 | #272 | Tragic 34.1% |
| Immigrants | Panama | 0.4 /100 | #273 | Tragic 34.0% |