Marshallese vs Immigrants from Malaysia In Labor Force | Age 16-19
COMPARE
Marshallese
Immigrants from Malaysia
In Labor Force | Age 16-19
In Labor Force | Age 16-19 Comparison
Marshallese
Immigrants from Malaysia
39.5%
IN LABOR FORCE | AGE 16-19
99.8/ 100
METRIC RATING
79th/ 347
METRIC RANK
34.3%
IN LABOR FORCE | AGE 16-19
0.7/ 100
METRIC RATING
266th/ 347
METRIC RANK
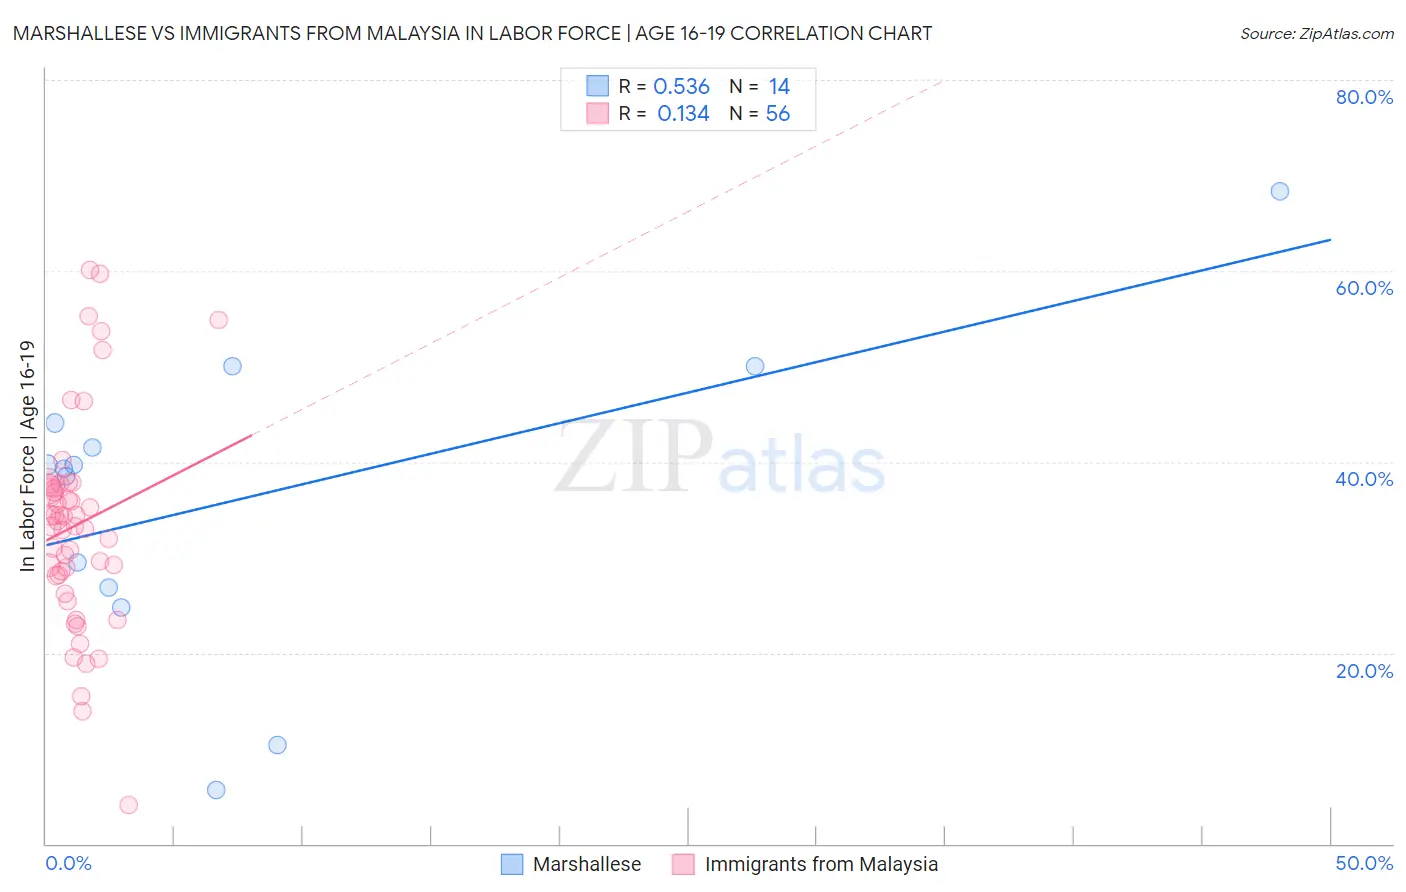
Marshallese vs Immigrants from Malaysia In Labor Force | Age 16-19 Correlation Chart
The statistical analysis conducted on geographies consisting of 14,757,218 people shows a substantial positive correlation between the proportion of Marshallese and labor force participation rate among population between the ages 16 and 19 in the United States with a correlation coefficient (R) of 0.536 and weighted average of 39.5%. Similarly, the statistical analysis conducted on geographies consisting of 197,895,635 people shows a poor positive correlation between the proportion of Immigrants from Malaysia and labor force participation rate among population between the ages 16 and 19 in the United States with a correlation coefficient (R) of 0.134 and weighted average of 34.3%, a difference of 15.1%.
In Labor Force | Age 16-19 Correlation Summary
| Measurement | Marshallese | Immigrants from Malaysia |
| Minimum | 5.6% | 4.0% |
| Maximum | 68.4% | 60.1% |
| Range | 62.8% | 56.1% |
| Mean | 36.3% | 33.4% |
| Median | 39.5% | 33.6% |
| Interquartile 25% (IQ1) | 26.8% | 28.1% |
| Interquartile 75% (IQ3) | 44.1% | 37.5% |
| Interquartile Range (IQR) | 17.3% | 9.4% |
| Standard Deviation (Sample) | 16.2% | 11.0% |
| Standard Deviation (Population) | 15.6% | 10.9% |
Similar Demographics by In Labor Force | Age 16-19
Demographics Similar to Marshallese by In Labor Force | Age 16-19
In terms of in labor force | age 16-19, the demographic groups most similar to Marshallese are Austrian (39.5%, a difference of 0.13%), Immigrants from Iraq (39.4%, a difference of 0.18%), Shoshone (39.3%, a difference of 0.46%), Immigrants from Portugal (39.7%, a difference of 0.52%), and Basque (39.3%, a difference of 0.52%).
| Demographics | Rating | Rank | In Labor Force | Age 16-19 |
| Iroquois | 99.9 /100 | #72 | Exceptional 39.9% |
| Immigrants | Middle Africa | 99.9 /100 | #73 | Exceptional 39.9% |
| Hungarians | 99.9 /100 | #74 | Exceptional 39.8% |
| French American Indians | 99.9 /100 | #75 | Exceptional 39.8% |
| Malaysians | 99.9 /100 | #76 | Exceptional 39.7% |
| Immigrants | Portugal | 99.9 /100 | #77 | Exceptional 39.7% |
| Austrians | 99.8 /100 | #78 | Exceptional 39.5% |
| Marshallese | 99.8 /100 | #79 | Exceptional 39.5% |
| Immigrants | Iraq | 99.8 /100 | #80 | Exceptional 39.4% |
| Shoshone | 99.7 /100 | #81 | Exceptional 39.3% |
| Basques | 99.7 /100 | #82 | Exceptional 39.3% |
| Spanish | 99.7 /100 | #83 | Exceptional 39.3% |
| Immigrants | Uganda | 99.7 /100 | #84 | Exceptional 39.2% |
| Creek | 99.6 /100 | #85 | Exceptional 39.1% |
| Samoans | 99.6 /100 | #86 | Exceptional 39.1% |
Demographics Similar to Immigrants from Malaysia by In Labor Force | Age 16-19
In terms of in labor force | age 16-19, the demographic groups most similar to Immigrants from Malaysia are Immigrants from El Salvador (34.3%, a difference of 0.090%), Immigrants from Uruguay (34.4%, a difference of 0.33%), Immigrants from Peru (34.2%, a difference of 0.36%), Immigrants from Asia (34.1%, a difference of 0.48%), and Pima (34.1%, a difference of 0.56%).
| Demographics | Rating | Rank | In Labor Force | Age 16-19 |
| Immigrants | Immigrants | 1.2 /100 | #259 | Tragic 34.6% |
| Egyptians | 1.2 /100 | #260 | Tragic 34.5% |
| Salvadorans | 1.1 /100 | #261 | Tragic 34.5% |
| Hispanics or Latinos | 1.1 /100 | #262 | Tragic 34.5% |
| Burmese | 1.1 /100 | #263 | Tragic 34.5% |
| Immigrants | Uruguay | 0.9 /100 | #264 | Tragic 34.4% |
| Immigrants | El Salvador | 0.7 /100 | #265 | Tragic 34.3% |
| Immigrants | Malaysia | 0.7 /100 | #266 | Tragic 34.3% |
| Immigrants | Peru | 0.5 /100 | #267 | Tragic 34.2% |
| Immigrants | Asia | 0.5 /100 | #268 | Tragic 34.1% |
| Pima | 0.5 /100 | #269 | Tragic 34.1% |
| Immigrants | Russia | 0.4 /100 | #270 | Tragic 34.1% |
| Central American Indians | 0.4 /100 | #271 | Tragic 34.1% |
| Asians | 0.4 /100 | #272 | Tragic 34.1% |
| Immigrants | Panama | 0.4 /100 | #273 | Tragic 34.0% |