Immigrants from Sierra Leone vs Iroquois No Schooling Completed
COMPARE
Immigrants from Sierra Leone
Iroquois
No Schooling Completed
No Schooling Completed Comparison
Immigrants from Sierra Leone
Iroquois
2.5%
NO SCHOOLING COMPLETED
0.5/ 100
METRIC RATING
262nd/ 347
METRIC RANK
1.9%
NO SCHOOLING COMPLETED
95.1/ 100
METRIC RATING
119th/ 347
METRIC RANK
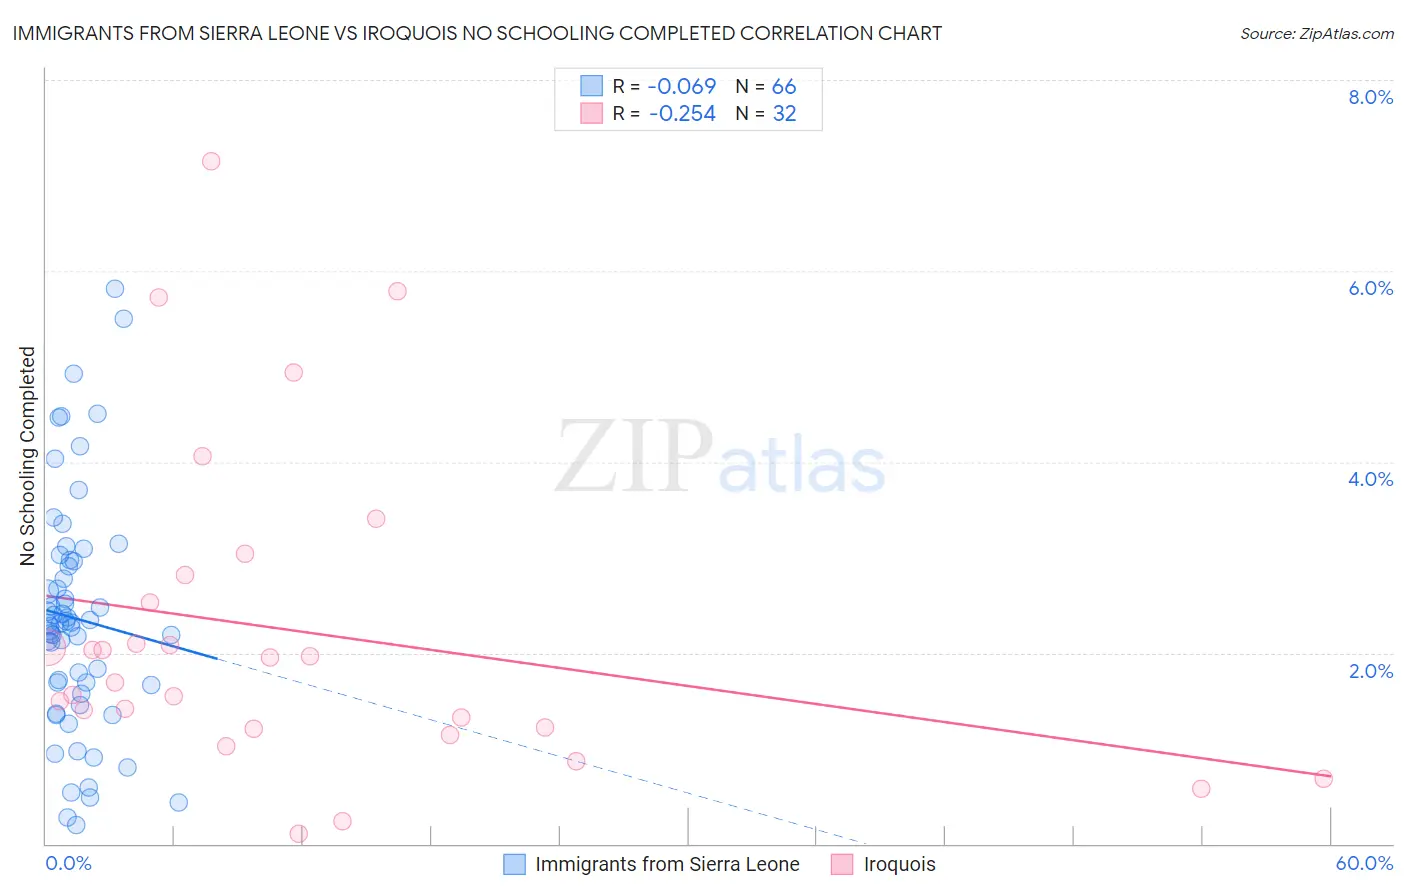
Immigrants from Sierra Leone vs Iroquois No Schooling Completed Correlation Chart
The statistical analysis conducted on geographies consisting of 101,407,363 people shows a slight negative correlation between the proportion of Immigrants from Sierra Leone and percentage of population with no schooling in the United States with a correlation coefficient (R) of -0.069 and weighted average of 2.5%. Similarly, the statistical analysis conducted on geographies consisting of 205,850,769 people shows a weak negative correlation between the proportion of Iroquois and percentage of population with no schooling in the United States with a correlation coefficient (R) of -0.254 and weighted average of 1.9%, a difference of 31.0%.
No Schooling Completed Correlation Summary
| Measurement | Immigrants from Sierra Leone | Iroquois |
| Minimum | 0.19% | 0.10% |
| Maximum | 5.8% | 7.1% |
| Range | 5.6% | 7.0% |
| Mean | 2.4% | 2.2% |
| Median | 2.3% | 1.8% |
| Interquartile 25% (IQ1) | 1.7% | 1.2% |
| Interquartile 75% (IQ3) | 3.0% | 2.7% |
| Interquartile Range (IQR) | 1.3% | 1.5% |
| Standard Deviation (Sample) | 1.2% | 1.7% |
| Standard Deviation (Population) | 1.2% | 1.6% |
Similar Demographics by No Schooling Completed
Demographics Similar to Immigrants from Sierra Leone by No Schooling Completed
In terms of no schooling completed, the demographic groups most similar to Immigrants from Sierra Leone are Immigrants from Liberia (2.5%, a difference of 0.17%), Indian (Asian) (2.5%, a difference of 0.30%), Armenian (2.5%, a difference of 0.35%), Immigrants from Ethiopia (2.5%, a difference of 0.48%), and West Indian (2.5%, a difference of 0.48%).
| Demographics | Rating | Rank | No Schooling Completed |
| Ethiopians | 0.8 /100 | #255 | Tragic 2.4% |
| Yaqui | 0.8 /100 | #256 | Tragic 2.4% |
| Immigrants | South America | 0.6 /100 | #257 | Tragic 2.5% |
| Assyrians/Chaldeans/Syriacs | 0.6 /100 | #258 | Tragic 2.5% |
| Immigrants | Jamaica | 0.6 /100 | #259 | Tragic 2.5% |
| Immigrants | Ethiopia | 0.6 /100 | #260 | Tragic 2.5% |
| Armenians | 0.5 /100 | #261 | Tragic 2.5% |
| Immigrants | Sierra Leone | 0.5 /100 | #262 | Tragic 2.5% |
| Immigrants | Liberia | 0.4 /100 | #263 | Tragic 2.5% |
| Indians (Asian) | 0.4 /100 | #264 | Tragic 2.5% |
| West Indians | 0.4 /100 | #265 | Tragic 2.5% |
| Fijians | 0.4 /100 | #266 | Tragic 2.5% |
| Yuman | 0.4 /100 | #267 | Tragic 2.5% |
| Taiwanese | 0.3 /100 | #268 | Tragic 2.5% |
| Immigrants | Nigeria | 0.2 /100 | #269 | Tragic 2.5% |
Demographics Similar to Iroquois by No Schooling Completed
In terms of no schooling completed, the demographic groups most similar to Iroquois are Spanish (1.9%, a difference of 0.35%), Immigrants from Bulgaria (1.9%, a difference of 0.40%), Immigrants from Croatia (1.9%, a difference of 0.47%), Cree (1.9%, a difference of 0.50%), and Immigrants from Serbia (1.9%, a difference of 0.58%).
| Demographics | Rating | Rank | No Schooling Completed |
| Pueblo | 96.4 /100 | #112 | Exceptional 1.9% |
| Immigrants | Zimbabwe | 96.2 /100 | #113 | Exceptional 1.9% |
| Immigrants | Norway | 96.1 /100 | #114 | Exceptional 1.9% |
| Syrians | 96.0 /100 | #115 | Exceptional 1.9% |
| Lebanese | 96.0 /100 | #116 | Exceptional 1.9% |
| Immigrants | Serbia | 95.8 /100 | #117 | Exceptional 1.9% |
| Spanish | 95.5 /100 | #118 | Exceptional 1.9% |
| Iroquois | 95.1 /100 | #119 | Exceptional 1.9% |
| Immigrants | Bulgaria | 94.6 /100 | #120 | Exceptional 1.9% |
| Immigrants | Croatia | 94.5 /100 | #121 | Exceptional 1.9% |
| Cree | 94.5 /100 | #122 | Exceptional 1.9% |
| Immigrants | Kuwait | 93.9 /100 | #123 | Exceptional 1.9% |
| Cambodians | 93.8 /100 | #124 | Exceptional 1.9% |
| Immigrants | Europe | 93.7 /100 | #125 | Exceptional 1.9% |
| Immigrants | Romania | 92.6 /100 | #126 | Exceptional 1.9% |