Immigrants from Scotland vs Seminole In Labor Force | Age 30-34
COMPARE
Immigrants from Scotland
Seminole
In Labor Force | Age 30-34
In Labor Force | Age 30-34 Comparison
Immigrants from Scotland
Seminole
85.1%
IN LABOR FORCE | AGE 30-34
94.9/ 100
METRIC RATING
111th/ 347
METRIC RANK
80.8%
IN LABOR FORCE | AGE 30-34
0.0/ 100
METRIC RATING
326th/ 347
METRIC RANK
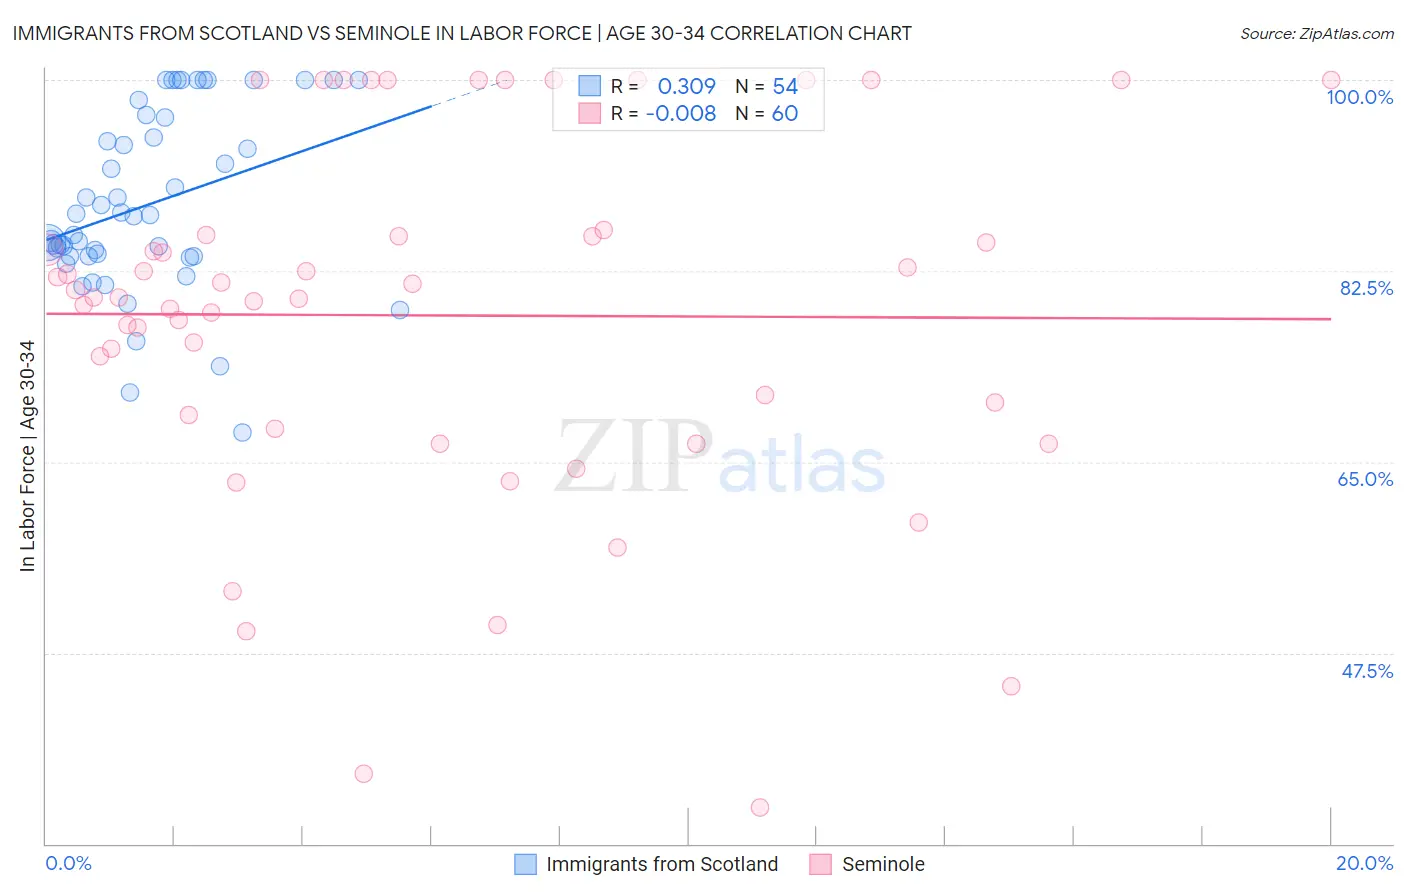
Immigrants from Scotland vs Seminole In Labor Force | Age 30-34 Correlation Chart
The statistical analysis conducted on geographies consisting of 196,354,267 people shows a mild positive correlation between the proportion of Immigrants from Scotland and labor force participation rate among population between the ages 30 and 34 in the United States with a correlation coefficient (R) of 0.309 and weighted average of 85.1%. Similarly, the statistical analysis conducted on geographies consisting of 118,296,286 people shows no correlation between the proportion of Seminole and labor force participation rate among population between the ages 30 and 34 in the United States with a correlation coefficient (R) of -0.008 and weighted average of 80.8%, a difference of 5.3%.
In Labor Force | Age 30-34 Correlation Summary
| Measurement | Immigrants from Scotland | Seminole |
| Minimum | 67.7% | 33.3% |
| Maximum | 100.0% | 100.0% |
| Range | 32.3% | 66.7% |
| Mean | 88.6% | 78.4% |
| Median | 87.6% | 80.0% |
| Interquartile 25% (IQ1) | 83.9% | 68.6% |
| Interquartile 75% (IQ3) | 96.5% | 85.7% |
| Interquartile Range (IQR) | 12.7% | 17.1% |
| Standard Deviation (Sample) | 8.2% | 16.5% |
| Standard Deviation (Population) | 8.1% | 16.3% |
Similar Demographics by In Labor Force | Age 30-34
Demographics Similar to Immigrants from Scotland by In Labor Force | Age 30-34
In terms of in labor force | age 30-34, the demographic groups most similar to Immigrants from Scotland are Immigrants from Hungary (85.1%, a difference of 0.0%), Immigrants from Romania (85.1%, a difference of 0.010%), Yugoslavian (85.1%, a difference of 0.010%), Immigrants from South Central Asia (85.1%, a difference of 0.010%), and Egyptian (85.1%, a difference of 0.010%).
| Demographics | Rating | Rank | In Labor Force | Age 30-34 |
| Immigrants | Ghana | 96.5 /100 | #104 | Exceptional 85.2% |
| Alsatians | 96.3 /100 | #105 | Exceptional 85.2% |
| Immigrants | Middle Africa | 96.3 /100 | #106 | Exceptional 85.2% |
| Immigrants | Northern Africa | 96.3 /100 | #107 | Exceptional 85.2% |
| Immigrants | Zimbabwe | 95.8 /100 | #108 | Exceptional 85.1% |
| Argentineans | 95.8 /100 | #109 | Exceptional 85.1% |
| Immigrants | South Africa | 95.3 /100 | #110 | Exceptional 85.1% |
| Immigrants | Scotland | 94.9 /100 | #111 | Exceptional 85.1% |
| Immigrants | Hungary | 94.8 /100 | #112 | Exceptional 85.1% |
| Immigrants | Romania | 94.7 /100 | #113 | Exceptional 85.1% |
| Yugoslavians | 94.7 /100 | #114 | Exceptional 85.1% |
| Immigrants | South Central Asia | 94.6 /100 | #115 | Exceptional 85.1% |
| Egyptians | 94.5 /100 | #116 | Exceptional 85.1% |
| Immigrants | Denmark | 94.3 /100 | #117 | Exceptional 85.1% |
| Immigrants | Malaysia | 94.2 /100 | #118 | Exceptional 85.1% |
Demographics Similar to Seminole by In Labor Force | Age 30-34
In terms of in labor force | age 30-34, the demographic groups most similar to Seminole are Colville (80.7%, a difference of 0.19%), Dutch West Indian (81.0%, a difference of 0.22%), Cheyenne (81.1%, a difference of 0.38%), Paiute (81.2%, a difference of 0.41%), and Puerto Rican (81.2%, a difference of 0.46%).
| Demographics | Rating | Rank | In Labor Force | Age 30-34 |
| Shoshone | 0.0 /100 | #319 | Tragic 81.4% |
| Yaqui | 0.0 /100 | #320 | Tragic 81.4% |
| Alaska Natives | 0.0 /100 | #321 | Tragic 81.3% |
| Puerto Ricans | 0.0 /100 | #322 | Tragic 81.2% |
| Paiute | 0.0 /100 | #323 | Tragic 81.2% |
| Cheyenne | 0.0 /100 | #324 | Tragic 81.1% |
| Dutch West Indians | 0.0 /100 | #325 | Tragic 81.0% |
| Seminole | 0.0 /100 | #326 | Tragic 80.8% |
| Colville | 0.0 /100 | #327 | Tragic 80.7% |
| Sioux | 0.0 /100 | #328 | Tragic 80.4% |
| Creek | 0.0 /100 | #329 | Tragic 80.4% |
| Pueblo | 0.0 /100 | #330 | Tragic 80.0% |
| Houma | 0.0 /100 | #331 | Tragic 79.9% |
| Kiowa | 0.0 /100 | #332 | Tragic 79.8% |
| Inupiat | 0.0 /100 | #333 | Tragic 79.7% |