Immigrants from Scotland vs Cape Verdean In Labor Force | Age 30-34
COMPARE
Immigrants from Scotland
Cape Verdean
In Labor Force | Age 30-34
In Labor Force | Age 30-34 Comparison
Immigrants from Scotland
Cape Verdeans
85.1%
IN LABOR FORCE | AGE 30-34
94.9/ 100
METRIC RATING
111th/ 347
METRIC RANK
85.6%
IN LABOR FORCE | AGE 30-34
99.7/ 100
METRIC RATING
51st/ 347
METRIC RANK
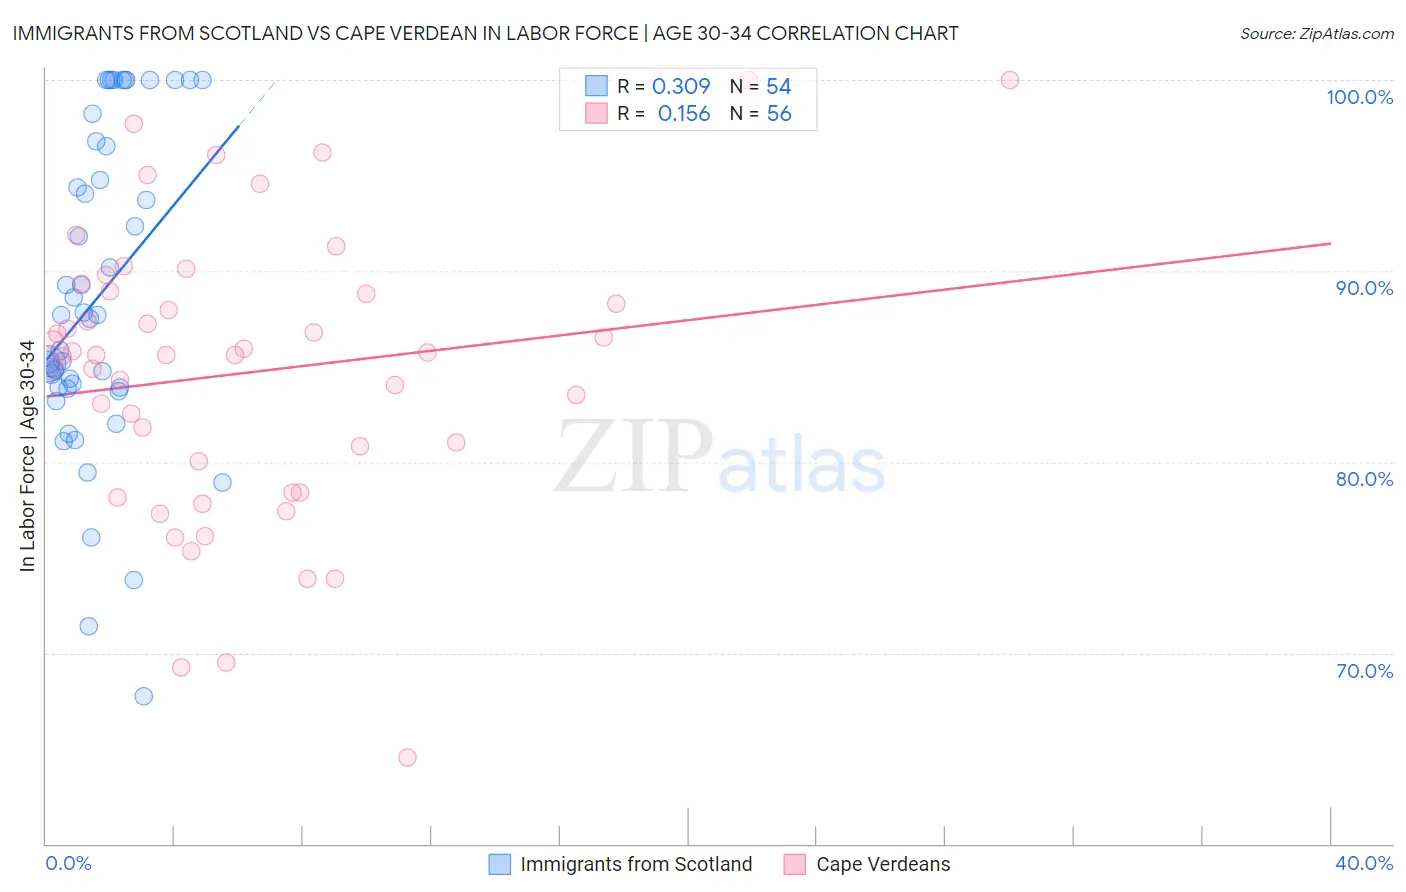
Immigrants from Scotland vs Cape Verdean In Labor Force | Age 30-34 Correlation Chart
The statistical analysis conducted on geographies consisting of 196,354,267 people shows a mild positive correlation between the proportion of Immigrants from Scotland and labor force participation rate among population between the ages 30 and 34 in the United States with a correlation coefficient (R) of 0.309 and weighted average of 85.1%. Similarly, the statistical analysis conducted on geographies consisting of 107,546,273 people shows a poor positive correlation between the proportion of Cape Verdeans and labor force participation rate among population between the ages 30 and 34 in the United States with a correlation coefficient (R) of 0.156 and weighted average of 85.6%, a difference of 0.53%.
In Labor Force | Age 30-34 Correlation Summary
| Measurement | Immigrants from Scotland | Cape Verdean |
| Minimum | 67.7% | 64.5% |
| Maximum | 100.0% | 100.0% |
| Range | 32.3% | 35.5% |
| Mean | 88.6% | 84.7% |
| Median | 87.6% | 85.6% |
| Interquartile 25% (IQ1) | 83.9% | 79.2% |
| Interquartile 75% (IQ3) | 96.5% | 88.9% |
| Interquartile Range (IQR) | 12.7% | 9.7% |
| Standard Deviation (Sample) | 8.2% | 7.5% |
| Standard Deviation (Population) | 8.1% | 7.4% |
Similar Demographics by In Labor Force | Age 30-34
Demographics Similar to Immigrants from Scotland by In Labor Force | Age 30-34
In terms of in labor force | age 30-34, the demographic groups most similar to Immigrants from Scotland are Immigrants from Hungary (85.1%, a difference of 0.0%), Immigrants from Romania (85.1%, a difference of 0.010%), Yugoslavian (85.1%, a difference of 0.010%), Immigrants from South Central Asia (85.1%, a difference of 0.010%), and Egyptian (85.1%, a difference of 0.010%).
| Demographics | Rating | Rank | In Labor Force | Age 30-34 |
| Immigrants | Ghana | 96.5 /100 | #104 | Exceptional 85.2% |
| Alsatians | 96.3 /100 | #105 | Exceptional 85.2% |
| Immigrants | Middle Africa | 96.3 /100 | #106 | Exceptional 85.2% |
| Immigrants | Northern Africa | 96.3 /100 | #107 | Exceptional 85.2% |
| Immigrants | Zimbabwe | 95.8 /100 | #108 | Exceptional 85.1% |
| Argentineans | 95.8 /100 | #109 | Exceptional 85.1% |
| Immigrants | South Africa | 95.3 /100 | #110 | Exceptional 85.1% |
| Immigrants | Scotland | 94.9 /100 | #111 | Exceptional 85.1% |
| Immigrants | Hungary | 94.8 /100 | #112 | Exceptional 85.1% |
| Immigrants | Romania | 94.7 /100 | #113 | Exceptional 85.1% |
| Yugoslavians | 94.7 /100 | #114 | Exceptional 85.1% |
| Immigrants | South Central Asia | 94.6 /100 | #115 | Exceptional 85.1% |
| Egyptians | 94.5 /100 | #116 | Exceptional 85.1% |
| Immigrants | Denmark | 94.3 /100 | #117 | Exceptional 85.1% |
| Immigrants | Malaysia | 94.2 /100 | #118 | Exceptional 85.1% |
Demographics Similar to Cape Verdeans by In Labor Force | Age 30-34
In terms of in labor force | age 30-34, the demographic groups most similar to Cape Verdeans are Slovene (85.6%, a difference of 0.010%), Immigrants from Australia (85.6%, a difference of 0.020%), Lithuanian (85.6%, a difference of 0.030%), Immigrants from Sweden (85.6%, a difference of 0.040%), and Immigrants from Morocco (85.6%, a difference of 0.050%).
| Demographics | Rating | Rank | In Labor Force | Age 30-34 |
| Immigrants | Sri Lanka | 99.8 /100 | #44 | Exceptional 85.6% |
| Immigrants | Nepal | 99.8 /100 | #45 | Exceptional 85.6% |
| Immigrants | Morocco | 99.8 /100 | #46 | Exceptional 85.6% |
| Croatians | 99.8 /100 | #47 | Exceptional 85.6% |
| Immigrants | Sweden | 99.8 /100 | #48 | Exceptional 85.6% |
| Lithuanians | 99.8 /100 | #49 | Exceptional 85.6% |
| Immigrants | Australia | 99.8 /100 | #50 | Exceptional 85.6% |
| Cape Verdeans | 99.7 /100 | #51 | Exceptional 85.6% |
| Slovenes | 99.7 /100 | #52 | Exceptional 85.6% |
| Filipinos | 99.6 /100 | #53 | Exceptional 85.5% |
| Immigrants | Kenya | 99.6 /100 | #54 | Exceptional 85.5% |
| Immigrants | Turkey | 99.6 /100 | #55 | Exceptional 85.5% |
| Czechs | 99.6 /100 | #56 | Exceptional 85.5% |
| Russians | 99.6 /100 | #57 | Exceptional 85.5% |
| Poles | 99.6 /100 | #58 | Exceptional 85.5% |