Immigrants from Scotland vs Seminole Professional Degree
COMPARE
Immigrants from Scotland
Seminole
Professional Degree
Professional Degree Comparison
Immigrants from Scotland
Seminole
5.3%
PROFESSIONAL DEGREE
99.5/ 100
METRIC RATING
90th/ 347
METRIC RANK
3.2%
PROFESSIONAL DEGREE
0.1/ 100
METRIC RATING
320th/ 347
METRIC RANK
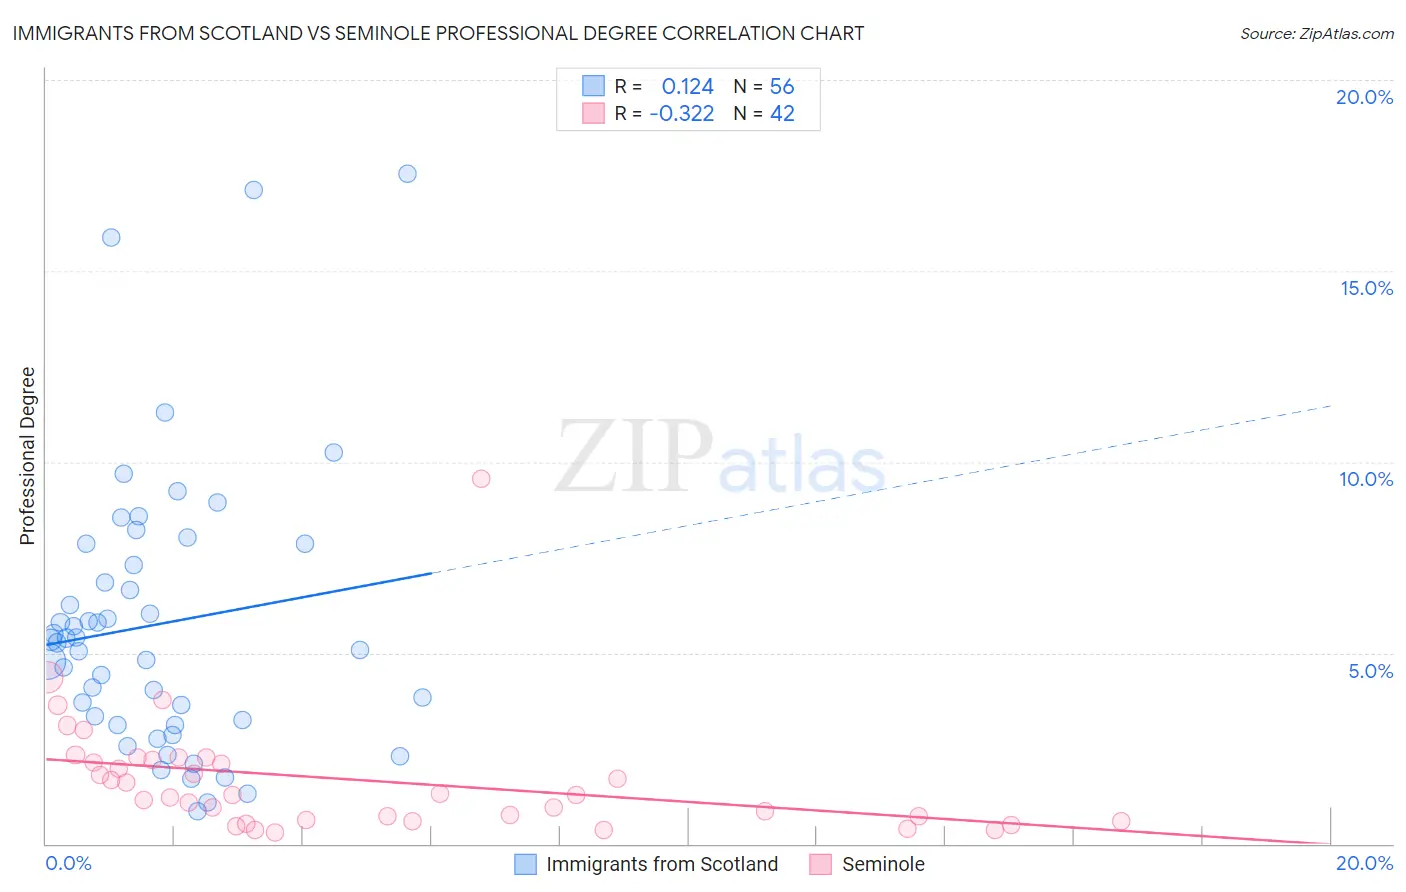
Immigrants from Scotland vs Seminole Professional Degree Correlation Chart
The statistical analysis conducted on geographies consisting of 196,234,125 people shows a poor positive correlation between the proportion of Immigrants from Scotland and percentage of population with at least professional degree education in the United States with a correlation coefficient (R) of 0.124 and weighted average of 5.3%. Similarly, the statistical analysis conducted on geographies consisting of 118,144,737 people shows a mild negative correlation between the proportion of Seminole and percentage of population with at least professional degree education in the United States with a correlation coefficient (R) of -0.322 and weighted average of 3.2%, a difference of 64.5%.
Professional Degree Correlation Summary
| Measurement | Immigrants from Scotland | Seminole |
| Minimum | 0.84% | 0.30% |
| Maximum | 17.6% | 9.6% |
| Range | 16.7% | 9.3% |
| Mean | 5.8% | 1.7% |
| Median | 5.3% | 1.3% |
| Interquartile 25% (IQ1) | 3.2% | 0.61% |
| Interquartile 75% (IQ3) | 7.6% | 2.2% |
| Interquartile Range (IQR) | 4.4% | 1.6% |
| Standard Deviation (Sample) | 3.6% | 1.6% |
| Standard Deviation (Population) | 3.6% | 1.6% |
Similar Demographics by Professional Degree
Demographics Similar to Immigrants from Scotland by Professional Degree
In terms of professional degree, the demographic groups most similar to Immigrants from Scotland are Egyptian (5.3%, a difference of 0.10%), Chilean (5.3%, a difference of 0.10%), Laotian (5.2%, a difference of 0.16%), Immigrants from Eastern Europe (5.2%, a difference of 0.20%), and Immigrants from Chile (5.3%, a difference of 0.24%).
| Demographics | Rating | Rank | Professional Degree |
| Carpatho Rusyns | 99.6 /100 | #83 | Exceptional 5.3% |
| Immigrants | Croatia | 99.6 /100 | #84 | Exceptional 5.3% |
| Immigrants | Zimbabwe | 99.6 /100 | #85 | Exceptional 5.3% |
| Greeks | 99.6 /100 | #86 | Exceptional 5.3% |
| Immigrants | Chile | 99.5 /100 | #87 | Exceptional 5.3% |
| Egyptians | 99.5 /100 | #88 | Exceptional 5.3% |
| Chileans | 99.5 /100 | #89 | Exceptional 5.3% |
| Immigrants | Scotland | 99.5 /100 | #90 | Exceptional 5.3% |
| Laotians | 99.5 /100 | #91 | Exceptional 5.2% |
| Immigrants | Eastern Europe | 99.5 /100 | #92 | Exceptional 5.2% |
| Northern Europeans | 99.3 /100 | #93 | Exceptional 5.2% |
| Alsatians | 99.3 /100 | #94 | Exceptional 5.2% |
| Zimbabweans | 99.3 /100 | #95 | Exceptional 5.2% |
| Immigrants | Uzbekistan | 99.2 /100 | #96 | Exceptional 5.2% |
| Syrians | 99.1 /100 | #97 | Exceptional 5.2% |
Demographics Similar to Seminole by Professional Degree
In terms of professional degree, the demographic groups most similar to Seminole are Tsimshian (3.2%, a difference of 0.36%), Hispanic or Latino (3.2%, a difference of 0.72%), Inupiat (3.2%, a difference of 0.80%), Crow (3.2%, a difference of 1.1%), and Choctaw (3.2%, a difference of 1.1%).
| Demographics | Rating | Rank | Professional Degree |
| Yuman | 0.1 /100 | #313 | Tragic 3.3% |
| Mexican American Indians | 0.1 /100 | #314 | Tragic 3.3% |
| Immigrants | Laos | 0.1 /100 | #315 | Tragic 3.2% |
| Puerto Ricans | 0.1 /100 | #316 | Tragic 3.2% |
| Nepalese | 0.1 /100 | #317 | Tragic 3.2% |
| Immigrants | Micronesia | 0.1 /100 | #318 | Tragic 3.2% |
| Choctaw | 0.1 /100 | #319 | Tragic 3.2% |
| Seminole | 0.1 /100 | #320 | Tragic 3.2% |
| Tsimshian | 0.0 /100 | #321 | Tragic 3.2% |
| Hispanics or Latinos | 0.0 /100 | #322 | Tragic 3.2% |
| Inupiat | 0.0 /100 | #323 | Tragic 3.2% |
| Crow | 0.0 /100 | #324 | Tragic 3.2% |
| Yaqui | 0.0 /100 | #325 | Tragic 3.2% |
| Menominee | 0.0 /100 | #326 | Tragic 3.1% |
| Dutch West Indians | 0.0 /100 | #327 | Tragic 3.1% |