Immigrants from Scotland vs Inupiat In Labor Force | Age 30-34
COMPARE
Immigrants from Scotland
Inupiat
In Labor Force | Age 30-34
In Labor Force | Age 30-34 Comparison
Immigrants from Scotland
Inupiat
85.1%
IN LABOR FORCE | AGE 30-34
94.9/ 100
METRIC RATING
111th/ 347
METRIC RANK
79.7%
IN LABOR FORCE | AGE 30-34
0.0/ 100
METRIC RATING
333rd/ 347
METRIC RANK
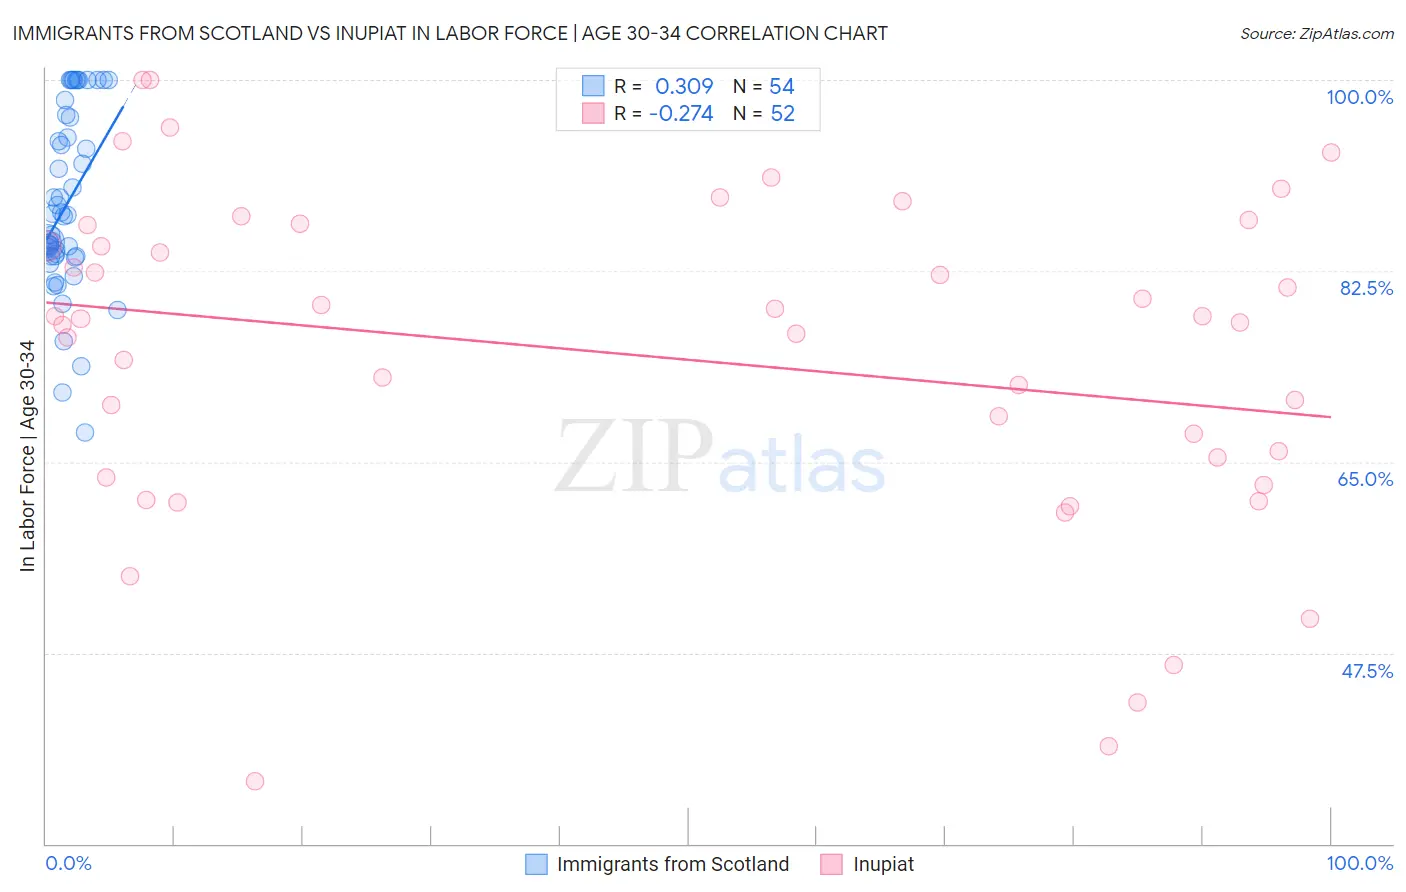
Immigrants from Scotland vs Inupiat In Labor Force | Age 30-34 Correlation Chart
The statistical analysis conducted on geographies consisting of 196,354,267 people shows a mild positive correlation between the proportion of Immigrants from Scotland and labor force participation rate among population between the ages 30 and 34 in the United States with a correlation coefficient (R) of 0.309 and weighted average of 85.1%. Similarly, the statistical analysis conducted on geographies consisting of 96,336,541 people shows a weak negative correlation between the proportion of Inupiat and labor force participation rate among population between the ages 30 and 34 in the United States with a correlation coefficient (R) of -0.274 and weighted average of 79.7%, a difference of 6.8%.
In Labor Force | Age 30-34 Correlation Summary
| Measurement | Immigrants from Scotland | Inupiat |
| Minimum | 67.7% | 35.7% |
| Maximum | 100.0% | 100.0% |
| Range | 32.3% | 64.3% |
| Mean | 88.6% | 74.7% |
| Median | 87.6% | 78.0% |
| Interquartile 25% (IQ1) | 83.9% | 64.5% |
| Interquartile 75% (IQ3) | 96.5% | 85.7% |
| Interquartile Range (IQR) | 12.7% | 21.3% |
| Standard Deviation (Sample) | 8.2% | 15.1% |
| Standard Deviation (Population) | 8.1% | 15.0% |
Similar Demographics by In Labor Force | Age 30-34
Demographics Similar to Immigrants from Scotland by In Labor Force | Age 30-34
In terms of in labor force | age 30-34, the demographic groups most similar to Immigrants from Scotland are Immigrants from Hungary (85.1%, a difference of 0.0%), Immigrants from Romania (85.1%, a difference of 0.010%), Yugoslavian (85.1%, a difference of 0.010%), Immigrants from South Central Asia (85.1%, a difference of 0.010%), and Egyptian (85.1%, a difference of 0.010%).
| Demographics | Rating | Rank | In Labor Force | Age 30-34 |
| Immigrants | Ghana | 96.5 /100 | #104 | Exceptional 85.2% |
| Alsatians | 96.3 /100 | #105 | Exceptional 85.2% |
| Immigrants | Middle Africa | 96.3 /100 | #106 | Exceptional 85.2% |
| Immigrants | Northern Africa | 96.3 /100 | #107 | Exceptional 85.2% |
| Immigrants | Zimbabwe | 95.8 /100 | #108 | Exceptional 85.1% |
| Argentineans | 95.8 /100 | #109 | Exceptional 85.1% |
| Immigrants | South Africa | 95.3 /100 | #110 | Exceptional 85.1% |
| Immigrants | Scotland | 94.9 /100 | #111 | Exceptional 85.1% |
| Immigrants | Hungary | 94.8 /100 | #112 | Exceptional 85.1% |
| Immigrants | Romania | 94.7 /100 | #113 | Exceptional 85.1% |
| Yugoslavians | 94.7 /100 | #114 | Exceptional 85.1% |
| Immigrants | South Central Asia | 94.6 /100 | #115 | Exceptional 85.1% |
| Egyptians | 94.5 /100 | #116 | Exceptional 85.1% |
| Immigrants | Denmark | 94.3 /100 | #117 | Exceptional 85.1% |
| Immigrants | Malaysia | 94.2 /100 | #118 | Exceptional 85.1% |
Demographics Similar to Inupiat by In Labor Force | Age 30-34
In terms of in labor force | age 30-34, the demographic groups most similar to Inupiat are Kiowa (79.8%, a difference of 0.12%), Houma (79.9%, a difference of 0.22%), Pueblo (80.0%, a difference of 0.40%), Hopi (79.3%, a difference of 0.58%), and Marshallese (79.2%, a difference of 0.62%).
| Demographics | Rating | Rank | In Labor Force | Age 30-34 |
| Seminole | 0.0 /100 | #326 | Tragic 80.8% |
| Colville | 0.0 /100 | #327 | Tragic 80.7% |
| Sioux | 0.0 /100 | #328 | Tragic 80.4% |
| Creek | 0.0 /100 | #329 | Tragic 80.4% |
| Pueblo | 0.0 /100 | #330 | Tragic 80.0% |
| Houma | 0.0 /100 | #331 | Tragic 79.9% |
| Kiowa | 0.0 /100 | #332 | Tragic 79.8% |
| Inupiat | 0.0 /100 | #333 | Tragic 79.7% |
| Hopi | 0.0 /100 | #334 | Tragic 79.3% |
| Marshallese | 0.0 /100 | #335 | Tragic 79.2% |
| Natives/Alaskans | 0.0 /100 | #336 | Tragic 79.2% |
| Yakama | 0.0 /100 | #337 | Tragic 79.1% |
| Pima | 0.0 /100 | #338 | Tragic 79.0% |
| Apache | 0.0 /100 | #339 | Tragic 79.0% |
| Ute | 0.0 /100 | #340 | Tragic 78.9% |